by CLC Staff
North Carolina will gain a seat in the next Congress thanks to an additional 900,000 souls who now call the Tar Heel state home. The question is why?
Based on population shifts reflected in the 2020 Census (and despite some fudged numbers), we join a handful of states which will have increased representation due to significant population growth over the last decade: Texas, Florida, Colorado, Oregon, and Montana.
That trend has continued in North Carolina (and in the South as a whole— the most populous of our country’s four regions) over the last two years as well. In fact, the Fayetteville-Sanford-Lumberton Combined Statistical Area (Moore, Lee, Harnett, Cumberland, Hoke, Scotland, and Robeson Counties) had the sixth largest net domestic migration in the nation from 2020 to 2021. Combined Statistical Areas (CSAs) are federal designations grouping adjacent metropolitan areas which share wide-ranging social and economic ties (think “Raleigh-Durham” or “Washington-Baltimore”).
And the most recent data shows that from June 1, 2021 to June 1, 2022, North Carolina was fourth in the nation (after Florida, Texas, and Arizona) for total net domestic migration. Combined, these top four states gained nearly 573,000 people from other states.
Conversely, New York, Illinois, Pennsylvania, Ohio, Michigan, and West Virginia each lost a seat in the U.S. House of Representatives following the 2020 Census, as did California — for the the first time in its history. And in the last year alone, New York, Illinois, and California lost a combined 842,000 people to other states.
People relocate from one state to another for a myriad of subjective reasons, of course, but the moving industry itself has revealed some consistent patterns over the years. Allied Van Lines, U-Haul, United Van Lines, and Bekins Moving Solutions all report that job prospects, affordability, education, closer proximity to family, retirement, lifestyle, and the weather all top their lists.
“A state’s fiscal landscape, including tax structure and burdens, plays a role in the types of employment opportunities available and whether prospective employees would be willing to move to a particular state for a job,” said Katherine Loughead of the Tax Foundation.
Can we look to the states to find more objective criteria? What do states that are gaining population have in common with one another? And what do states that are losing population have in common with one another? And what significant differences are there between these two groups?
We turned first to the American Conservative Union’s Center for Legislative Accountability for some answers. Each year, the group ranks state legislatures based on how closely they hew to conservative principles (North Carolina comes in fifth among the states). Their survey looks at a wide range of issues, including taxation, spending, education, labor, regulation, environment, life, free speech, and Second Amendment rights.
Of the six states that gained seats in the U.S. House of Representatives (Texas, Florida, Colorado, Oregon, Montana, and North Carolina) all but two (Colorado and Oregon) ranked highly; of the seven states that lost seats (California, New York, Illinois, Pennsylvania, Ohio, Michigan, and West Virginia) all but two (Ohio and West Virginia) ranked poorly.
Mark Perry, professor emeritus of economics at the University of Michigan and a Senior Fellow Emeritus of the American Enterprise Institute, came up with similar results. He analyzed the six states that gained population and the seven states that lost population based on 11 criteria: if the state is a “right to work” state, the state-local tax burden as a percentage of income, the state’s top individual income tax rate, the state’s top corporate tax rate, Forbes Magazine’s “Best States for Business” ranking, the Tax Foundation’s State Business Tax Climate Ranking, U.S. News & World Report’s Fiscal Stability Ranking, the cost of electricity, real GDP growth rate, the state’s unemployment rate, and employment growth.
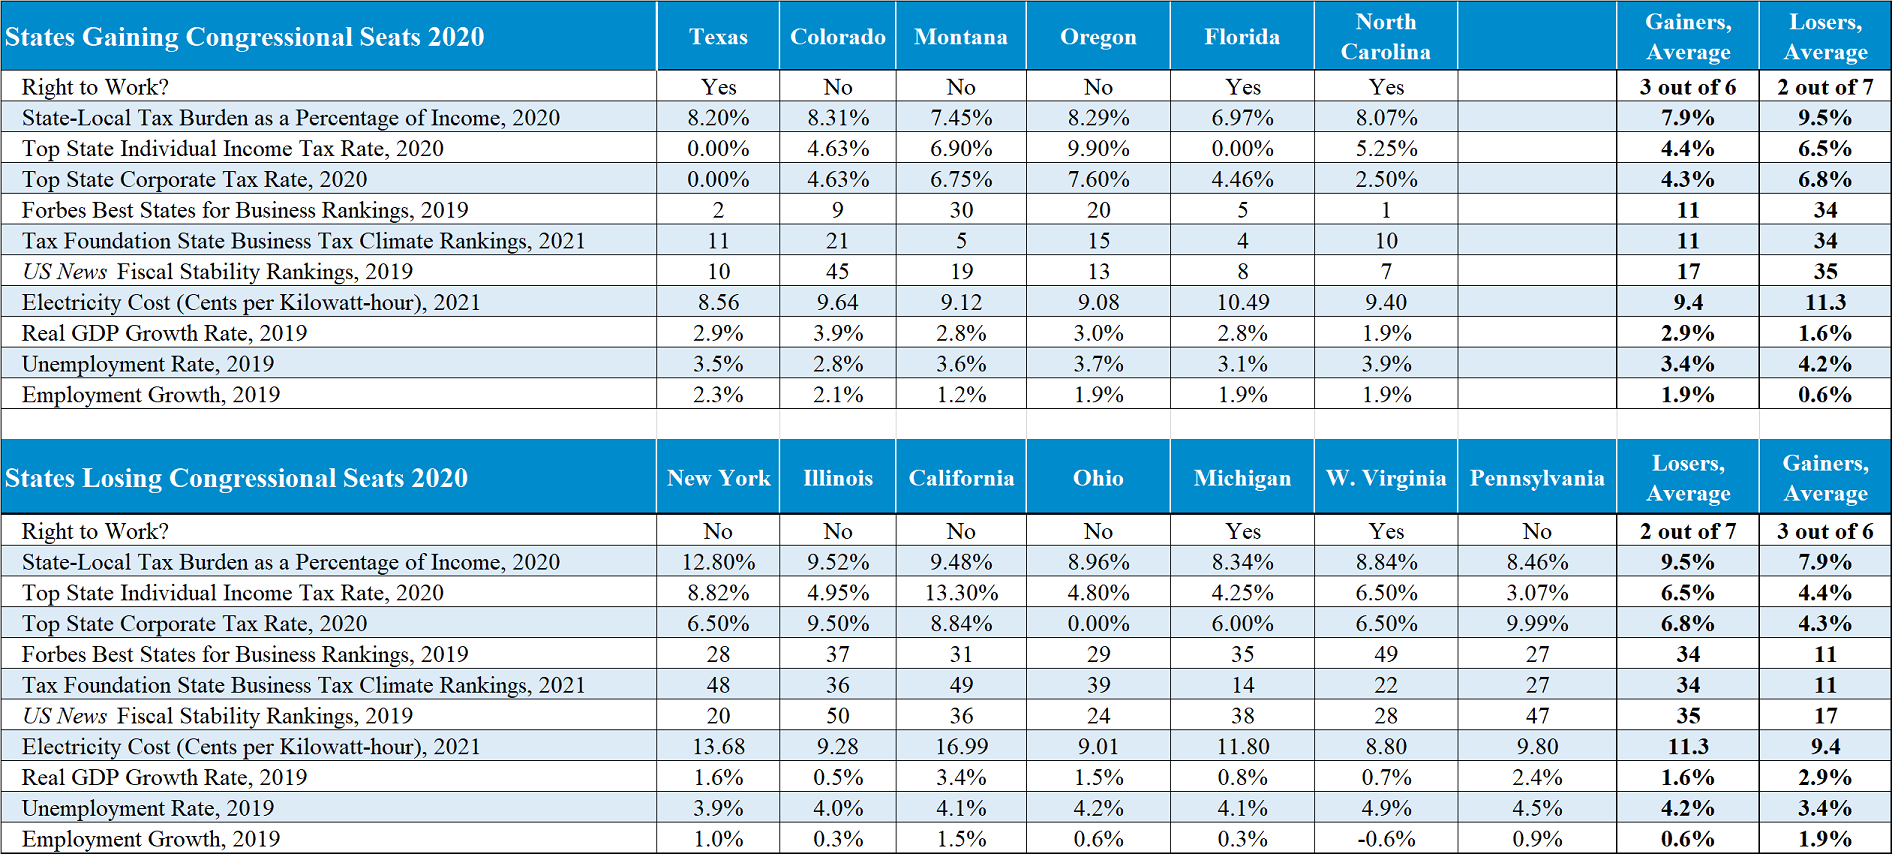
Dr. Perry concluded that “on each of those 11 measures, there is empirical evidence that the six gaining states are on average out-performing the seven losing states, suggesting that migration patterns in the U.S. do reflect Americans and firms “voting/moving with their feet” from high-tax, business-unfriendly, fiscally unhealthy, economically stagnant states with relatively high utility (electricity) costs to lower-tax, more business-friendly, fiscally healthy and economically vibrant states with lower energy costs.”
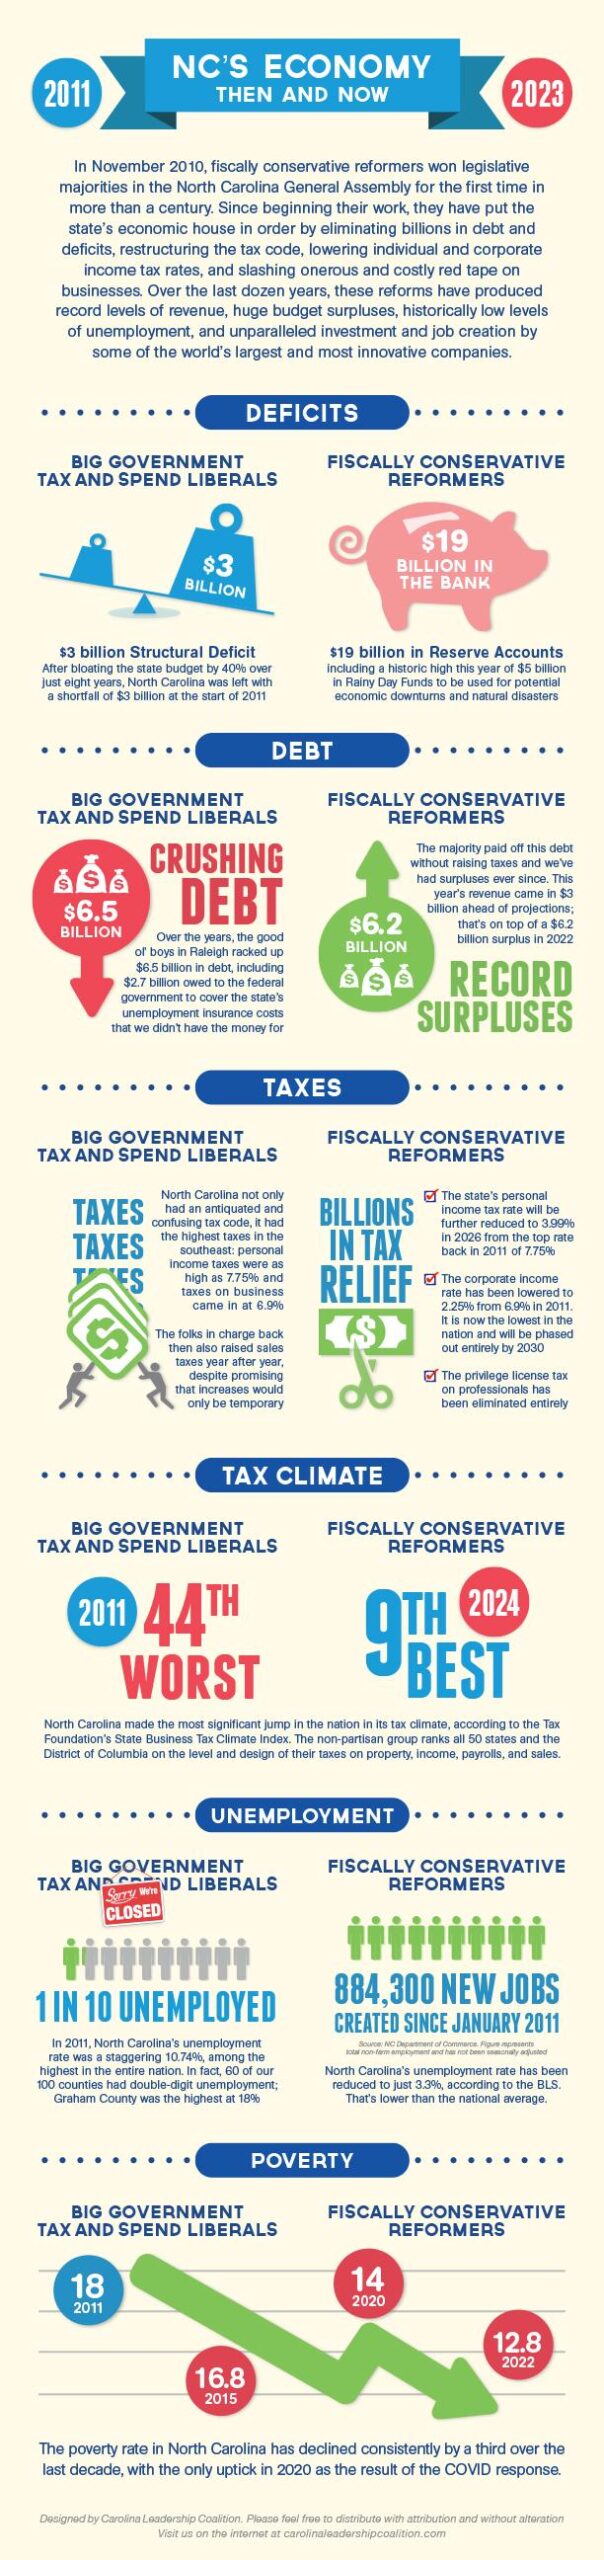
The evidence is clear: Americans are fleeing high tax states for states where fiscally conservative reforms have produced the nation’s leading economic outcomes. Throw in some barbecue, and North Carolina tops the list.