by CLC Staff
First, the Bad News.
There’s not much to smile about coming out of Washington these days. Last week, the economy entered a recession — following two straight quarters of negative growth — and the inflation rate keeps climbing higher. You’d be forgiven if you didn’t know (or can’t remember) what high inflation feels like; it’s now at levels not seen since before the compact disc player was even a thing. In fact, inflation hasn’t increased this much over a two-year span since President Joe Biden was first elected to the U.S. Senate 50 years ago.
“For many North Carolinians, it already feels like a recession and has for a long time,” commented N.C. House Speaker Tim Moore. “Thanks to inflation, soaring prices at the gas pump and the grocery store, President Biden’s failed economy has made it tougher for us to pay for everyday expenses and monthly bills. Redefining the word recession to fit their narrative doesn’t make the recession go away. And it certainly does nothing to help Americans whose paychecks are being stretched thinner and thinner.”
What is Inflation?
Broadly speaking, inflation occurs when prices rise over time throughout a nation’s economy. Although there is no single cause for inflation, generally the reasons relate to the basic economic principle of supply and demand: too many dollars are chasing too few goods.
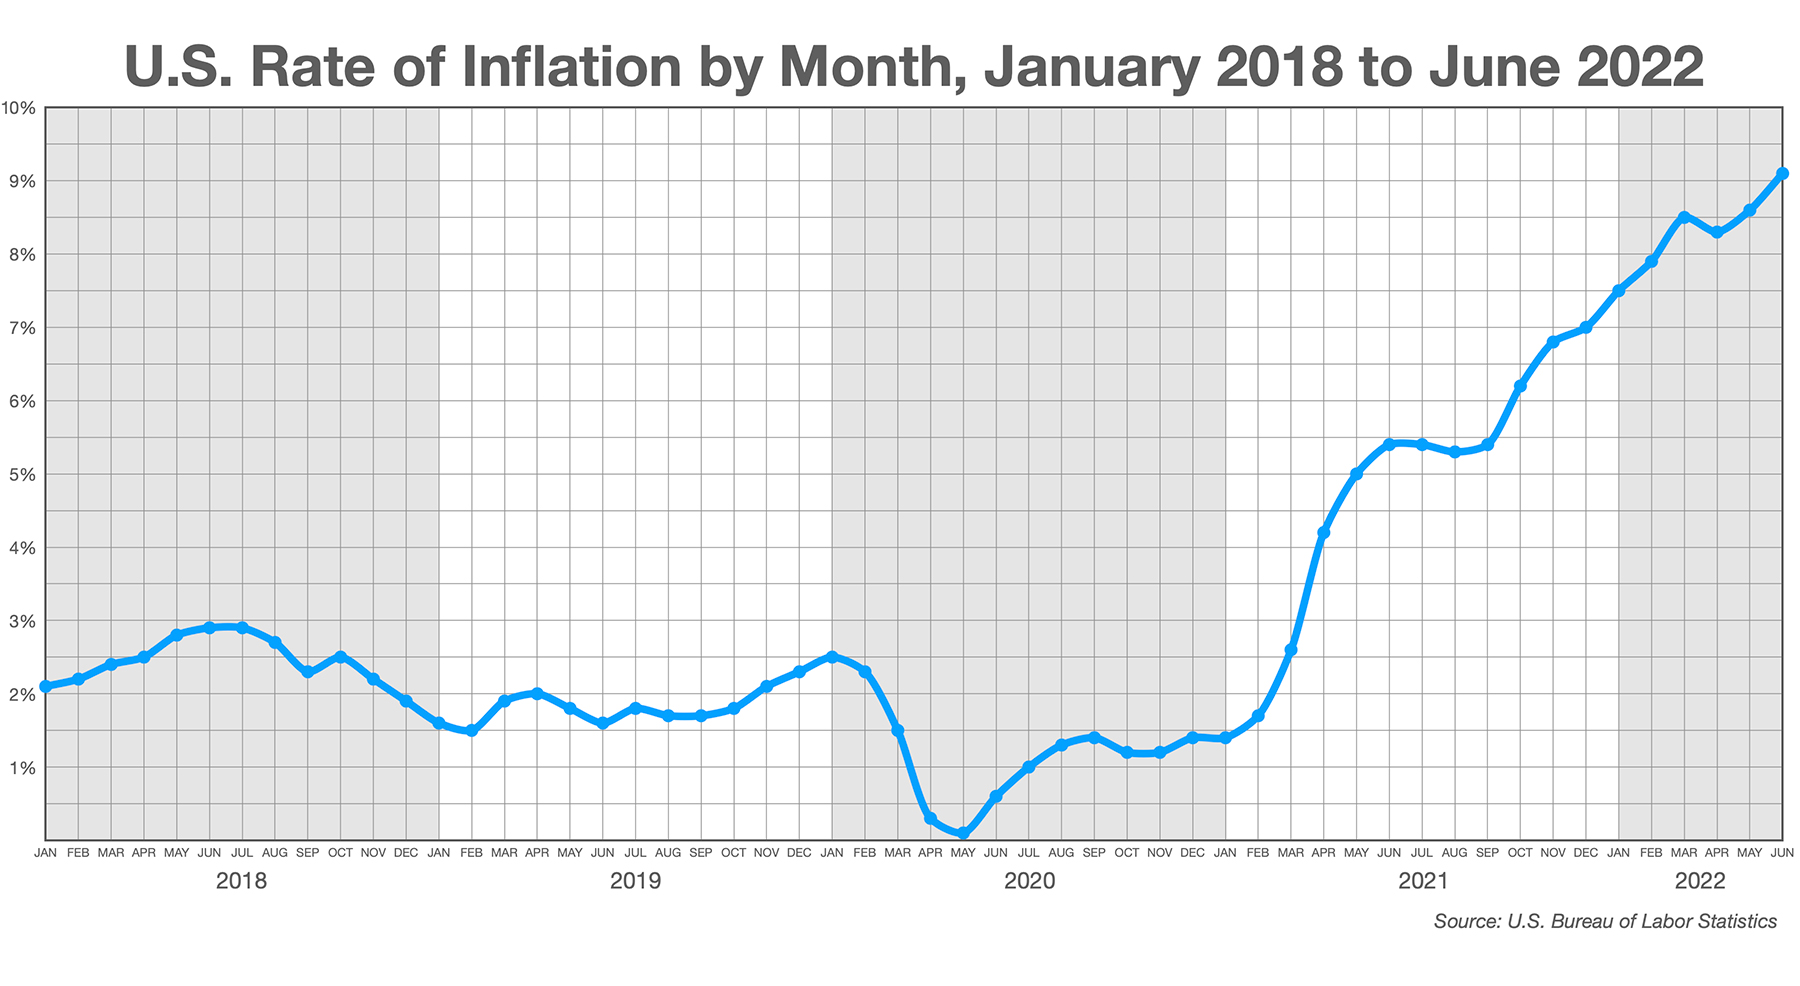
“When the pandemic struck, the Federal Reserve and Federal government, together, flooded the economy with more dollars,” writes Mike Patton at Forbes. “How much more? In January 2020, the M2 money supply was around $15.41 trillion. This past April, only 16 months later, the M2 money supply was at $20.11 trillion, representing an increase of 30% (Editor’s Note: the M2 Money supply was $21.67 trillion as of June 2022). “While this may have boosted the economy and helped avoid a more serious recession, it also contributed to higher inflation.”
How is Inflation Measured?
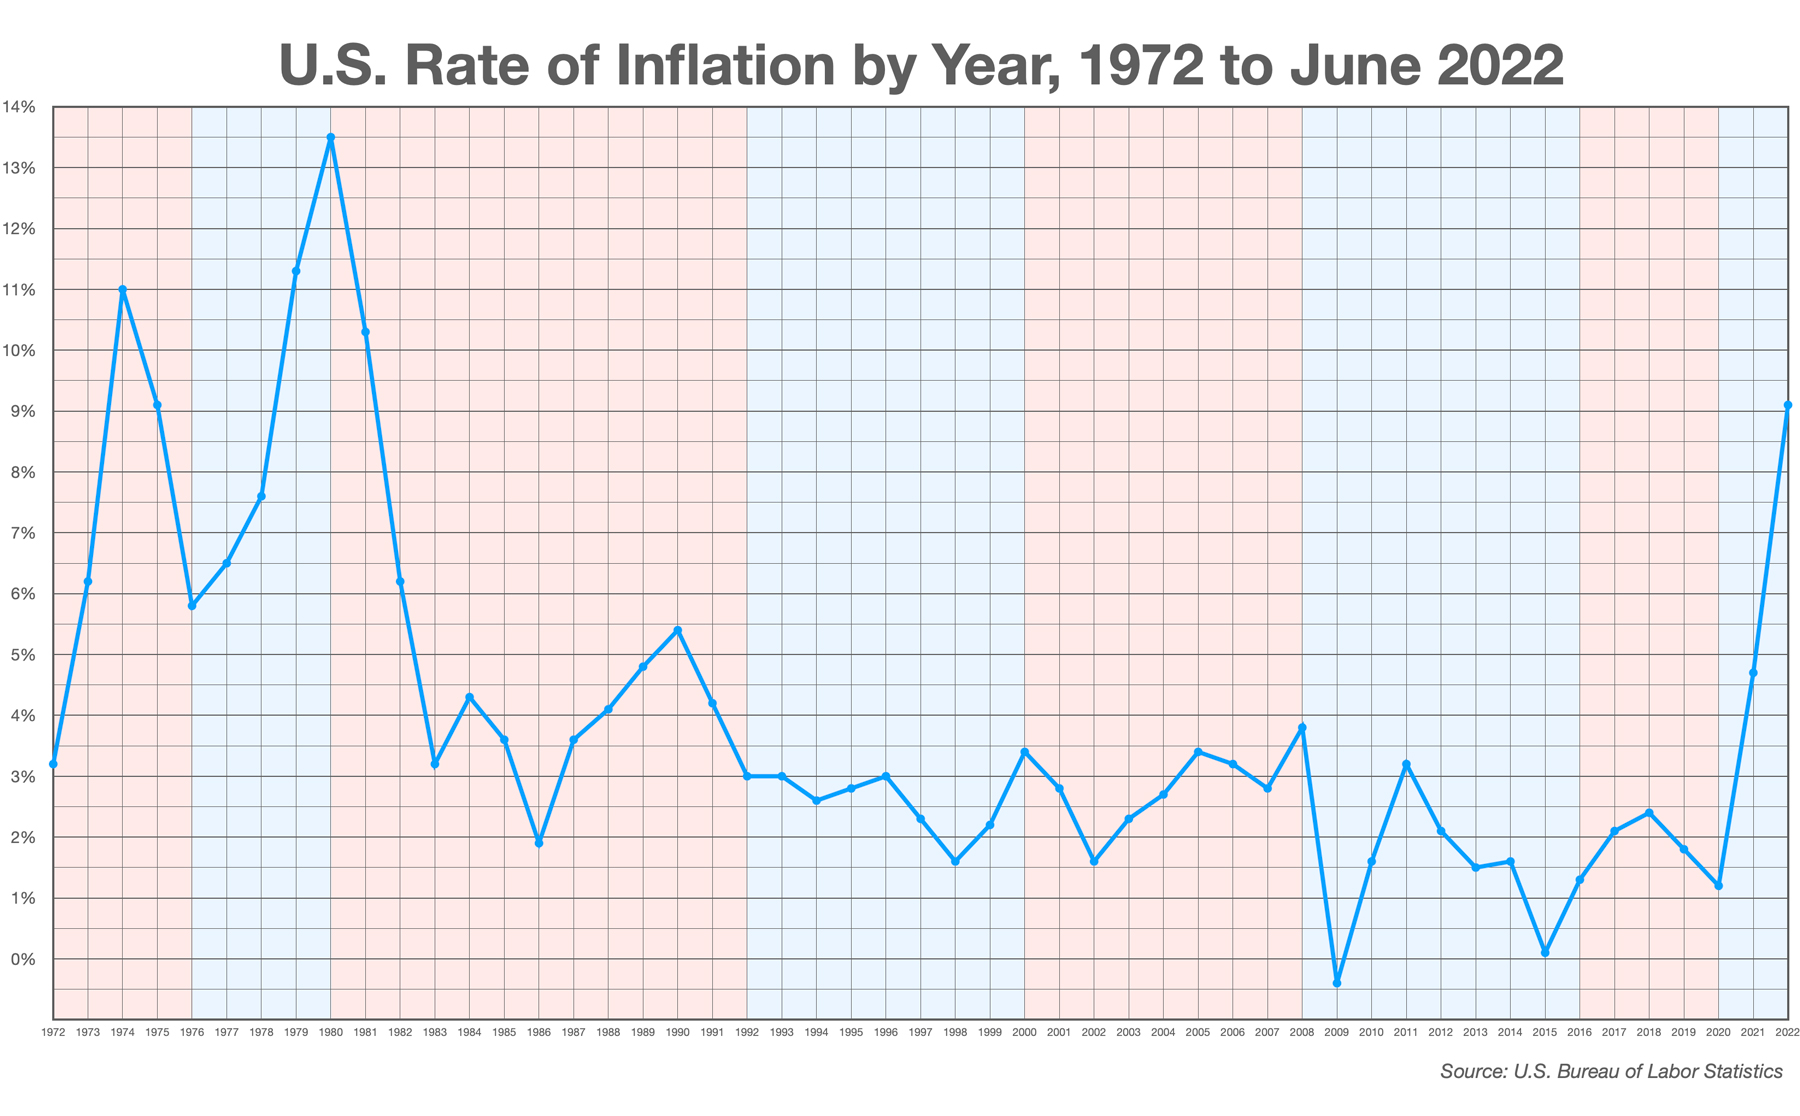
Inflation is most commonly measured by something called the Consumer Price Index (CPI), a detailed monthly report that attempts to calculate the average price nationally of more than more than 340 detailed categories of goods and services (in eight major groups, such as food and energy) purchased by consumers. Each category is then assigned a weight relative to its importance to the average consumer to get a “price index” for each category. That’s all put together to crank out each month’s year-over-year inflation rate change for each item (what things cost now compared to a year ago). For June 2022 (the most recent data available), the weighted average of all the items on the list (it’s on the top line of the report) was an increase of 9.1% compared to June 2021, and the highest rate increase since March 1980 (when it was 14.8%, averaged to 13.5% over the year).
But, like any average, that percentage is a little sketchy. According to June’s CPI, fuel oil costs 98.5% more in June 2022 than it did in June 2021; overall food costs went up 10.4%, the most since February 1981, with food at home jumping 12.2%. But a new television will cost you 12.7% less.
And none of this takes into account a whole host of market factors (e.g. state fiscal policies, supply chain issues, geography, etc.). Gas costs more in Asheville than it does in Wilmington because you’ve got to truck it up to the mountains; it costs a whole lot less in Texas than it does in California because of the Golden State’s high state excise taxes.
The important thing here is that when prices rise, the purchasing power of your money decreases. In other words, it takes more and more money to buy the same stuff. We feel this pinch every day, and inflation hits different age groups differently and lower-income people disproportionately harder.
Remember your crazy uncle saying that it only cost him a buck fifty to go to the movies back in the day? He was right. According to NATO (the National Association Theatre Owners), the average ticket price in 1969 was $1.42; in 2019, that same ticket would cost you $9.16.
For good measure, the nerds at the Bureau of Labor Statistics (BLS), which compiles the CPI, have a neat online tool called the “CPI Inflation Calculator” that crunches all the inflation data in the United States since before the First World War. Say you made $36,000 a year back in 2002. If you want to know what you would need to make now to maintain the same standard of living, that’s the place to find it. (Spoiler: it’s $59,295.14.)
To be continued…