by CLC Staff
Still looking for that perfect, last-minute gift to share with your loved-ones on Christmas morning? Fear not! For behold, we bring you tidings of great joy: the Carolina Leadership Coalition has publicly released the first batch of results from our latest statewide poll.
Conducted for CLC by Meeting Street Insights between November 17 and November 22 of this year, this first survey had a sampling size of 500 registered voters in North Carolina. The second and third surveys were conducted among 400 Democratic primary voters and 400 Republican voters in North Carolina between November 22 and December 1. We will release those results next week.
The surveys covered several key topics, including North Carolina’s political environment, the issue agenda, the economy, state taxes, the impact of COVID-19, public school education, and a number of other hot-button issues.
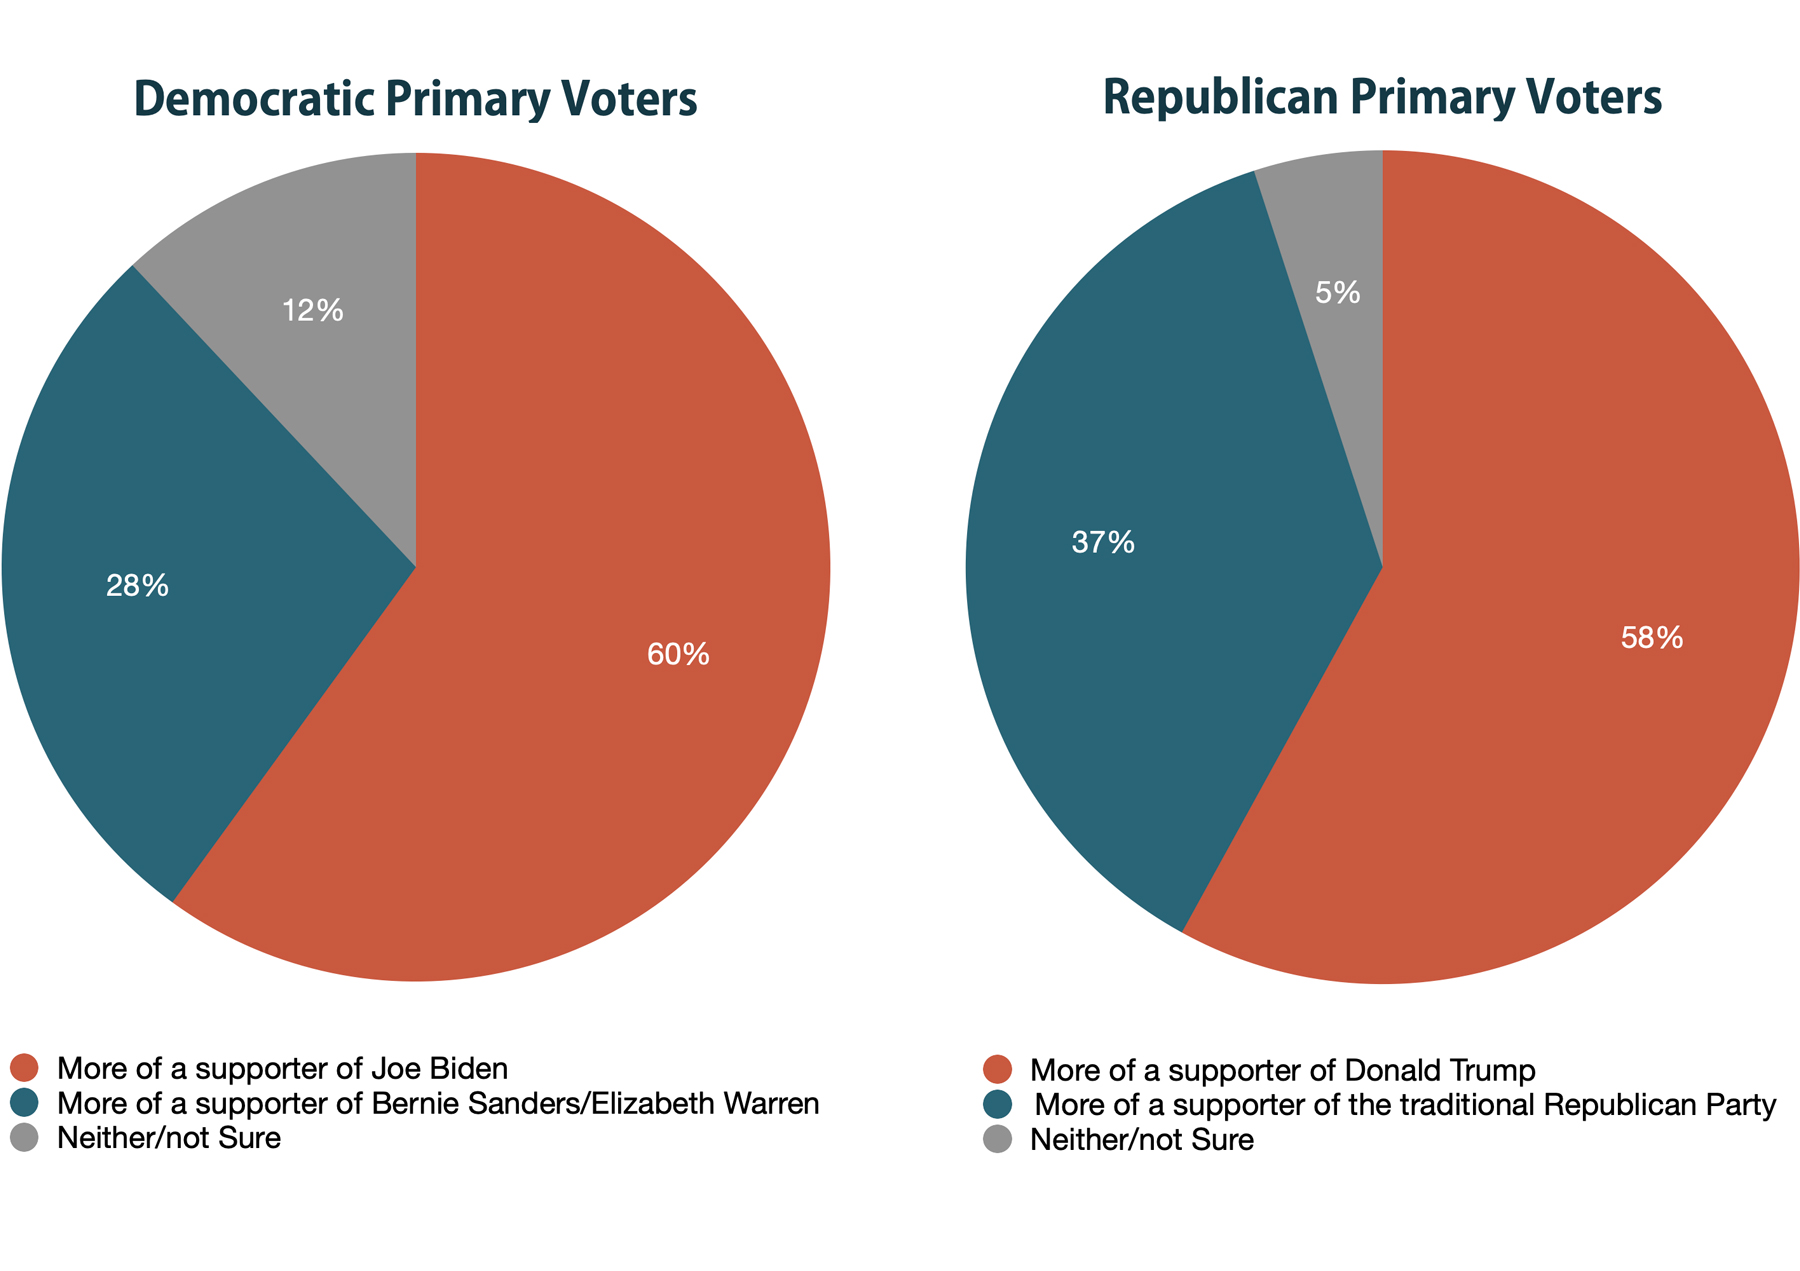
Among North Carolina’s Democratic primary voters, 60% characterized themselves as ideologically more supportive of President Joe Biden and his agenda as compared to 28% who considered themselves more ideologically aligned with progressive Senators Bernie Sanders of Vermont and Elizabeth Warren of Massachusetts. 12% said they supported neither faction or were not sure.
Among North Carolina’s Republican primary voters, 58% characterized themselves as more supportive of former president Donald Trump and his agenda as compared to 37% who indicated they were more supportive of candidates aligning themselves with a more traditional or “establishment” version of the Republican Party. Just 5% said they supported neither faction or were not sure.
The Political Environment
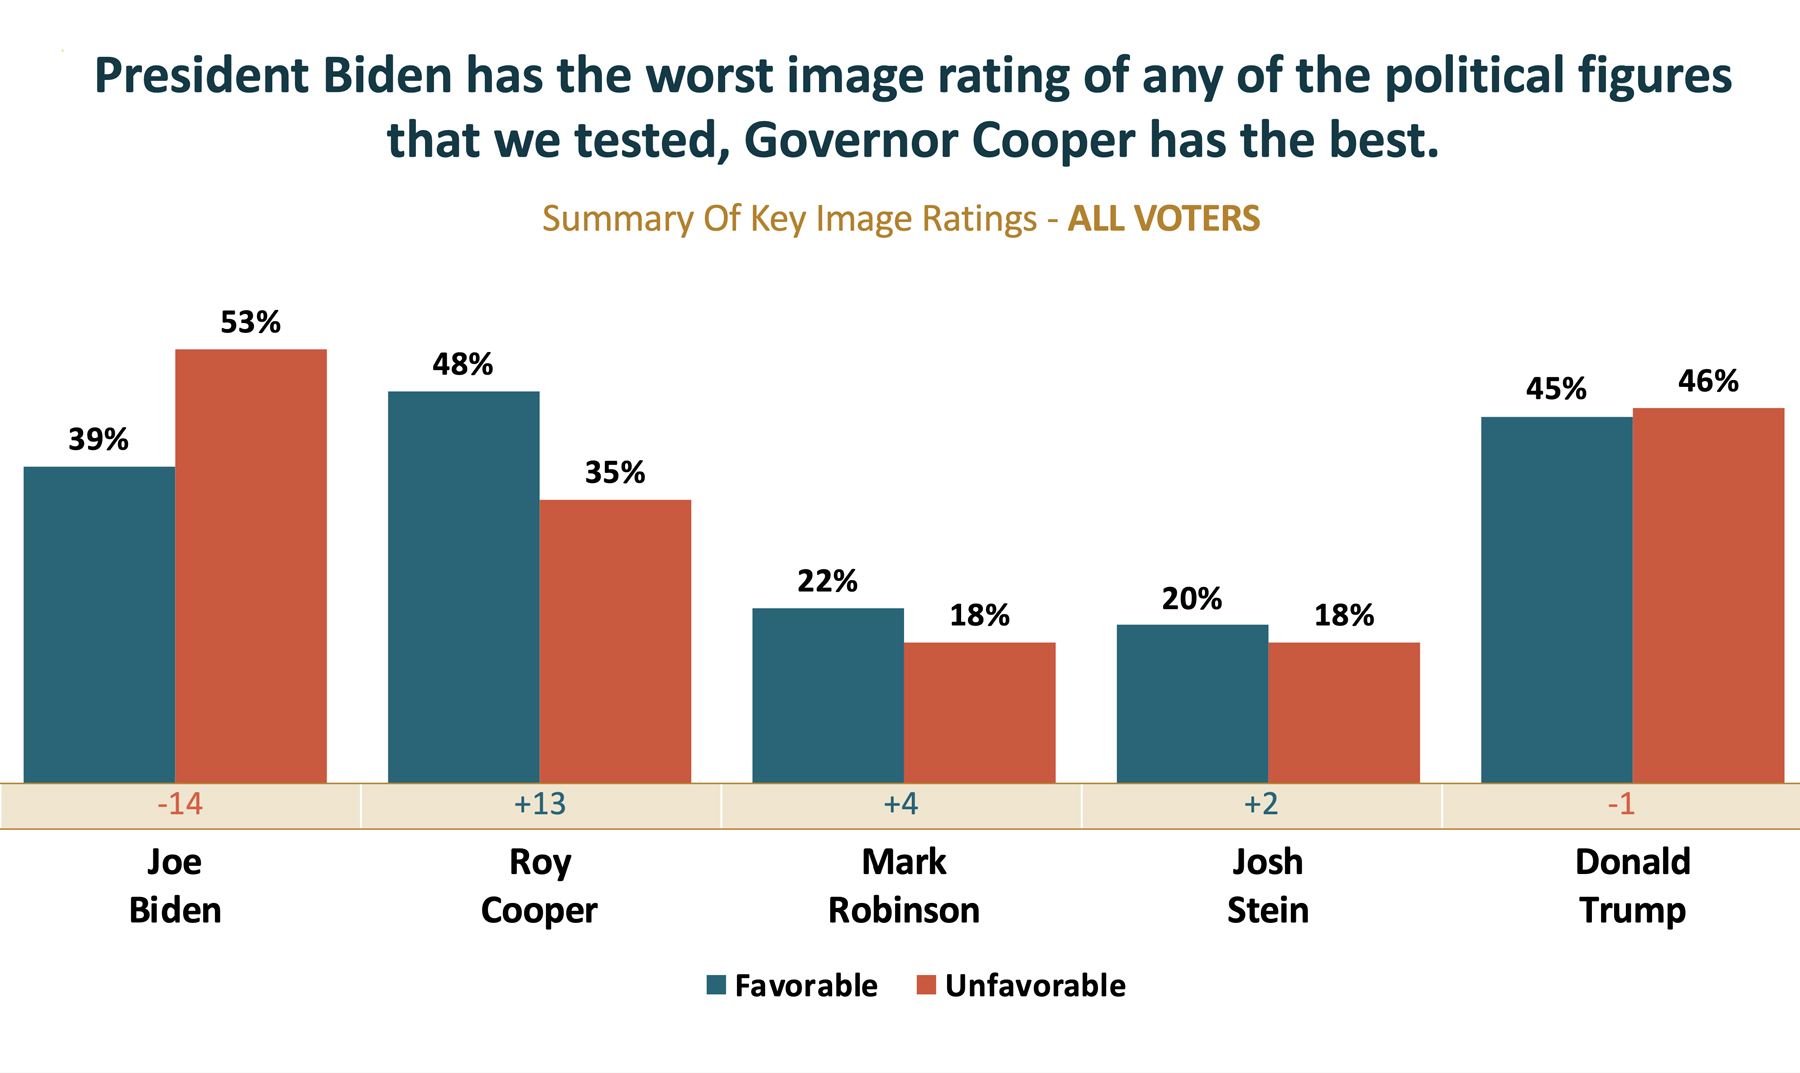
Respondents in the first survey were asked to characterize several political figures with either a “favorable” or “unfavorable” rating. North Carolina Governor Roy Cooper (D) had the highest number of respondents giving him a favorable characterization at 48%, while President Joe Biden (D) had the highest number of respondents giving him an unfavorable characterization, at 53%. Former president Donald Trump (R) essentially broke even, with a 45%/46% favorable-unfavorable rating; Lieutenant Governor Mark Robinson (R) and Attorney General Josh Stein (D), who many political observers predict will run against one another in North Carolina’s 2024 gubernatorial race, were essentially tied with one another in both their favorable-unfavorable ratings. Their low individual aggregate ratings suggest that less than half of the 500 respondents have yet to form an opinion on either of them one way or the other.
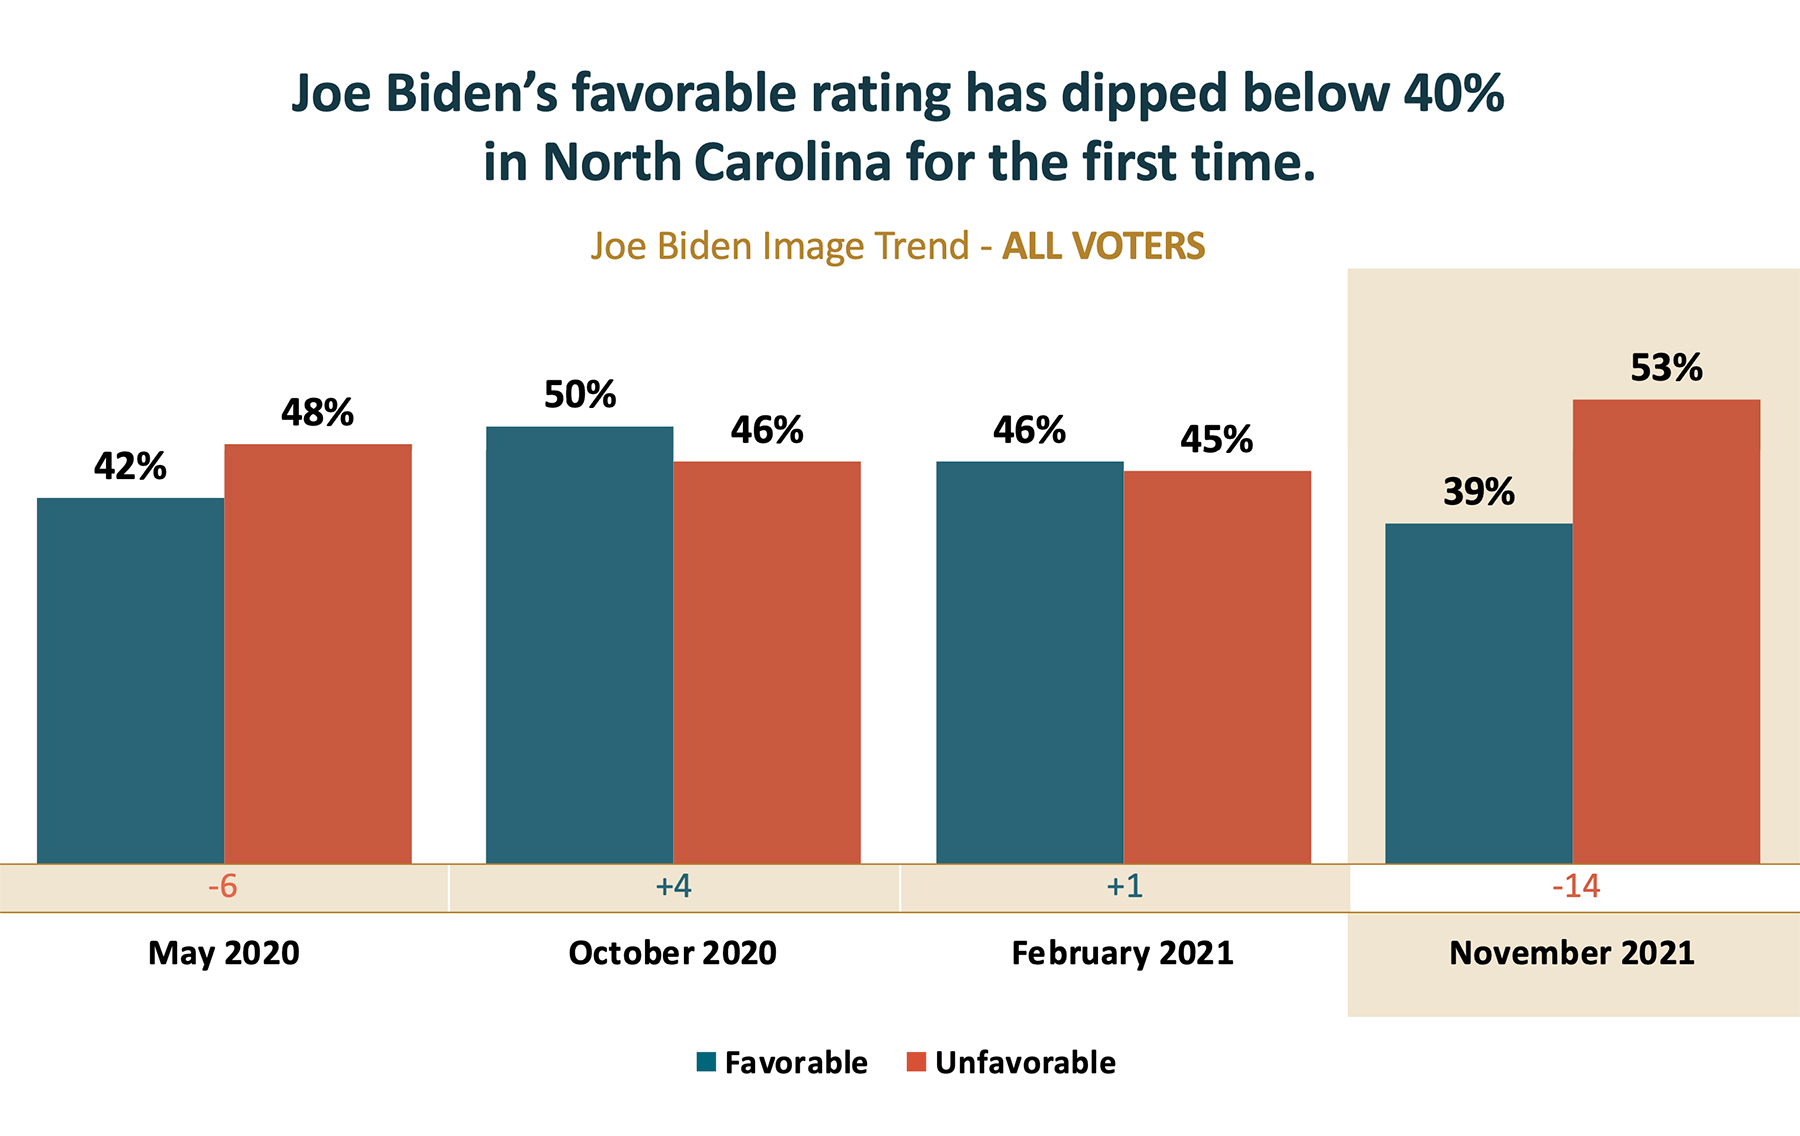
For the first time since winning Wisconsin’s Democratic presidential primary (the last contested race of the 2020 nomination cycle) on April 7, Joe Biden’s favorability rating is under 40% among registered voters in North Carolina. According to our polling firm’s data, immediately prior to the 2020 general election on November 3, candidate Biden garnered a 46% unfavorable rating. (Editor’s note: Former president Donald Trump ended up winning North Carolina’s 15 electors by just 74,483 votes, with 49.93% going to Mr. Trump and 48.59% breaking for Mr. Biden.)
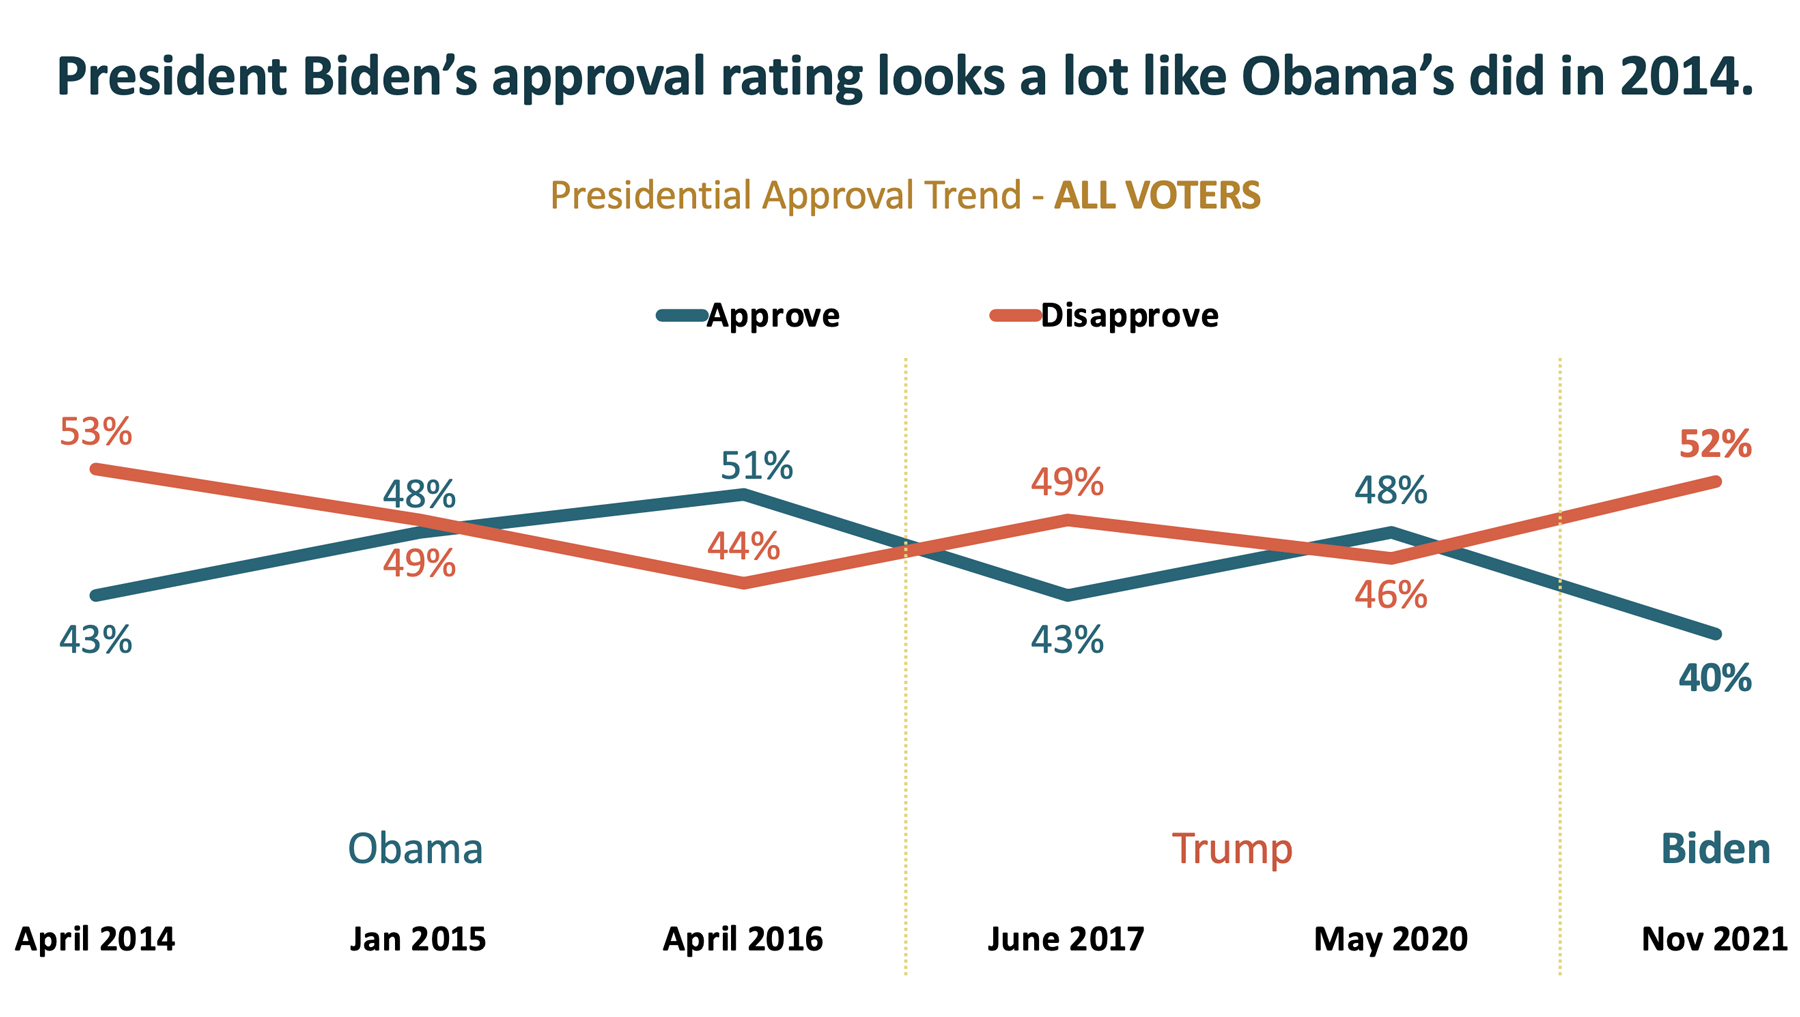
For historical reference, President Biden’s approva/disapproval ratings in November of 2021 are very similar to then-president Barack Obama’s in April of 2014.
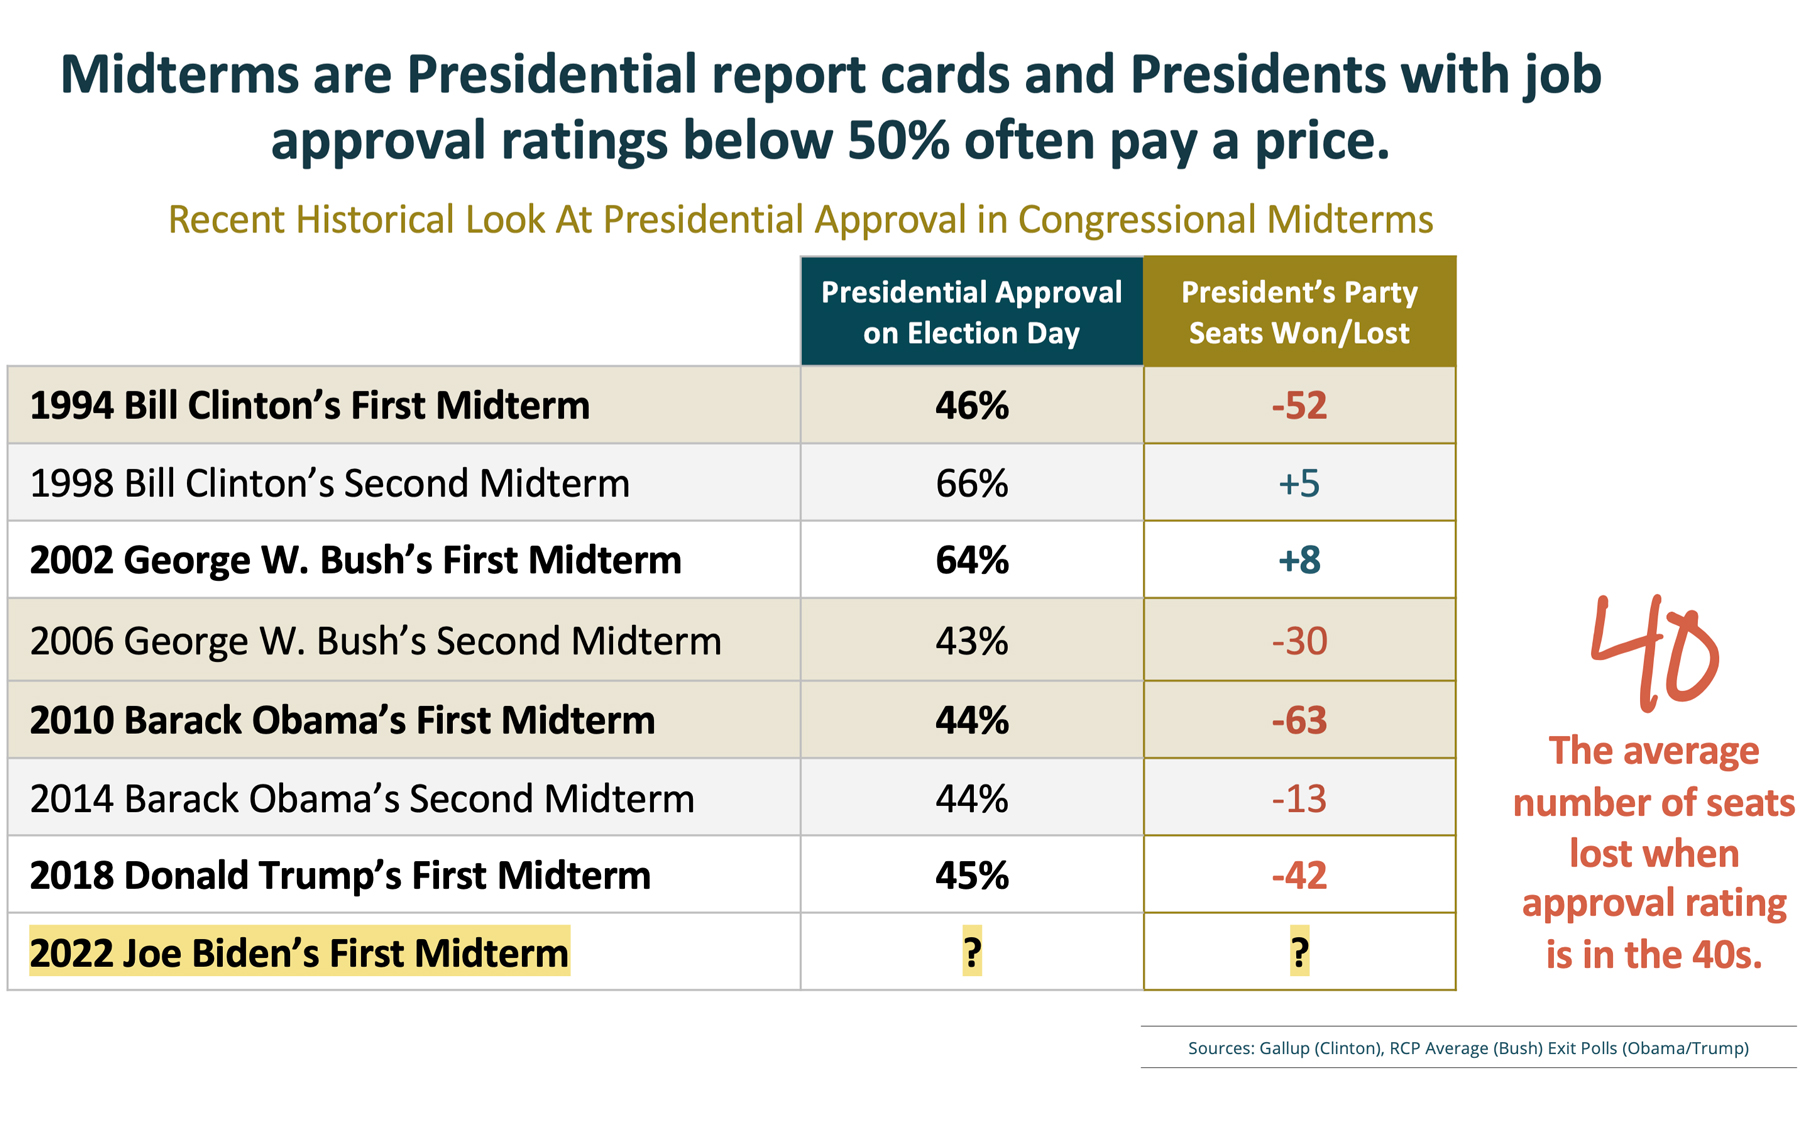
Mid-term congressional elections (held in the even year following the year a president is elected or re-elected) are seen as barometers, or “report cards” on an incumbent president’s job performance. And almost without exception, the president’s political party suffers losses. In fact, midterm elections since 1934 have resulted in an average loss of 28 seats in the House of Representatives by the president’s party.
In 1938, the midterm following his re-election in 1936, President Franklin Roosevelt lost 81 House Democrats and seven Senate Democrats — the largest such loss of the twentieth century. Following closely behind, President Barack Obama lost 63 House Democrats in 2020, President Bill Clinton lost 52 House Democrats in 1994, and Presidents Dwight Eisenhower and Richard Nixon both lost 48 House Republicans in 1958 and 1974, respectively.
In fact, since 1938, the party whose president occupies the White House has lost seats in the House of Representatives for every mid-term election with the exception of only two: President Bill Clinton in 1998, following his re-election in 1996, and President George W. Bush in 2002, the mid-term following his election in 2000.
Presidents with job approval ratings below 50% on Election Day are accurate harbingers of this dynamic as can be seen in the following chart. (Editor’s note: For a detailed chart on congressional gains and losses by the president’s party in mid-term elections, please see The University of California’s American Presidency Project.)
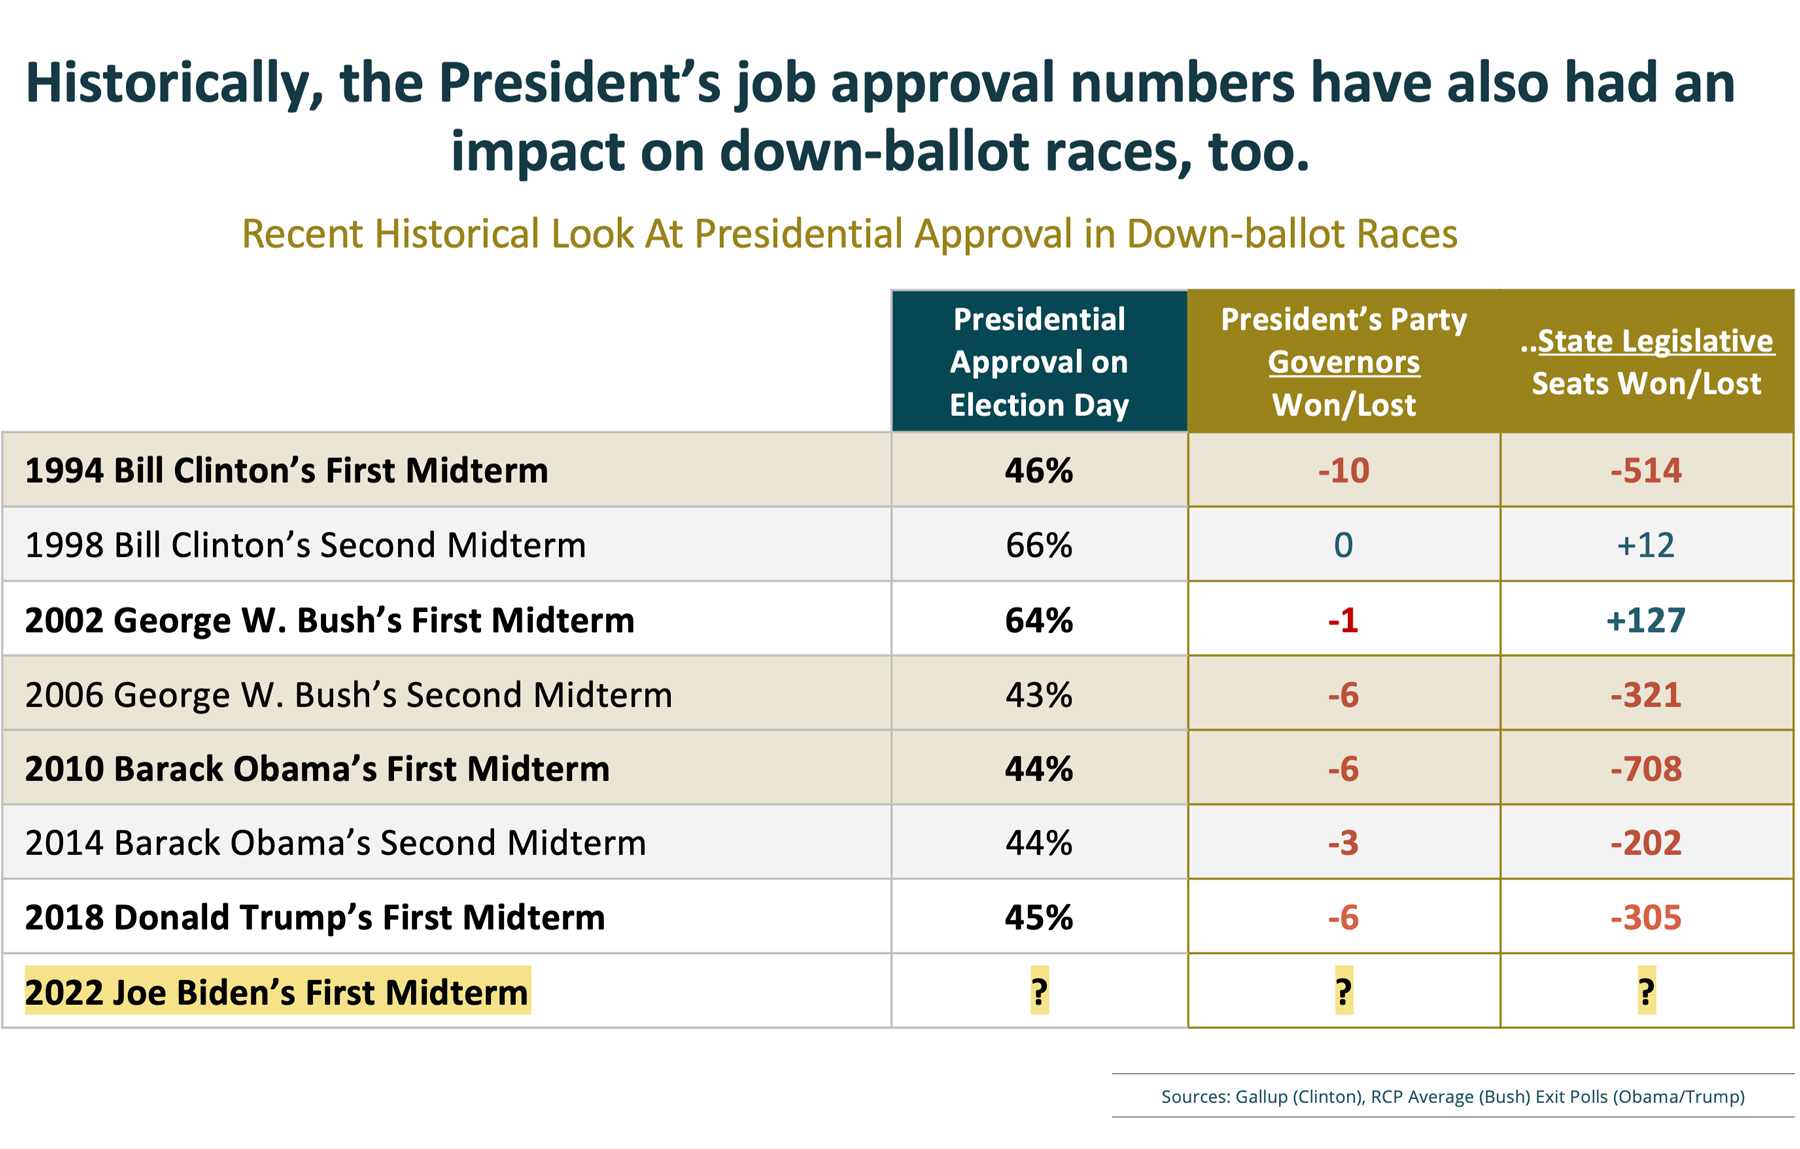
Congressional elections are not the only ones that are affected by an incumbent president’s approval ratings. Gubenatorial and state legislative races are affected as well. President Obama lost 708 state legislative seats in 2010, the first mid-term election following his 2008 victory.
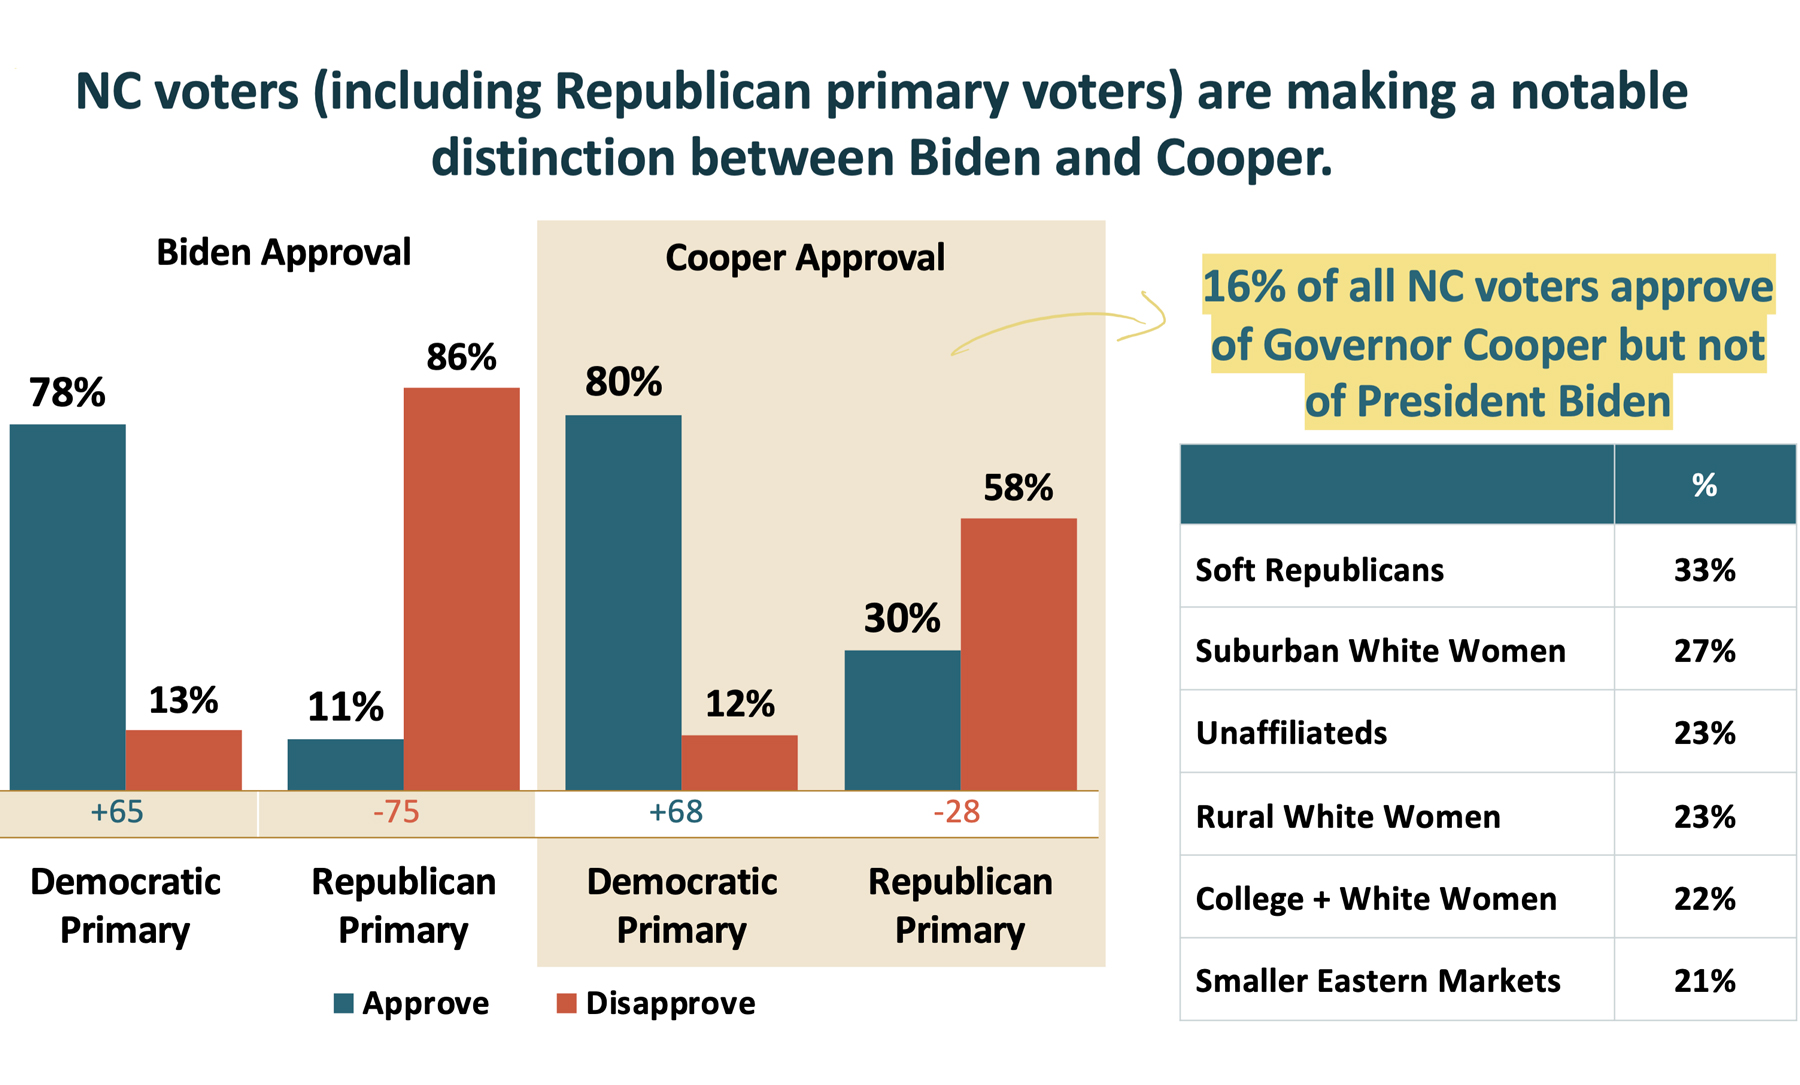
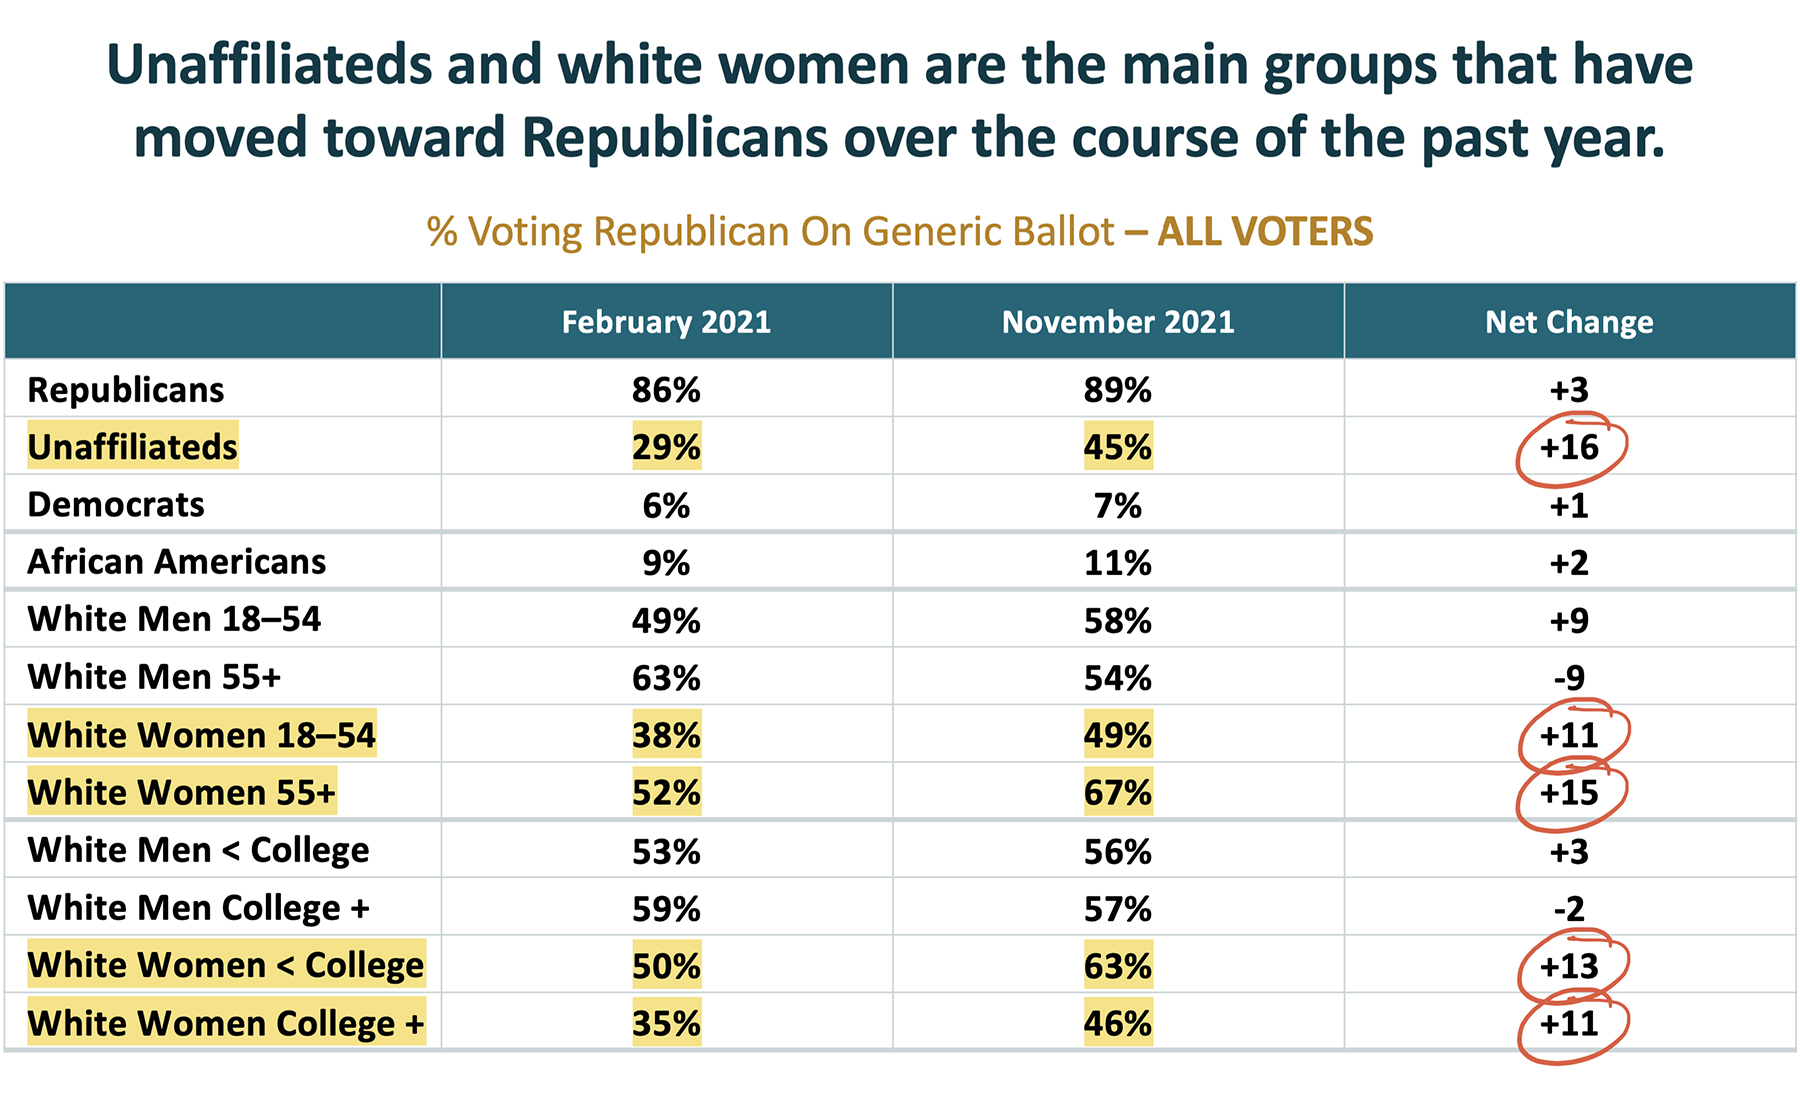
There are several more key takeaways from the first survey of 500 registered voters: 1) Governor Roy Cooper’s favorable/unfavorable ratings have remained largely the same over the last few years; 2) North Carolina’s voters (including Republican primary voters) are making a notable distinction between Presdient Biden and Governor Cooper; and 3) Unaffiliated voters and white women are the main groups that favor Republican candidates since President Biden assumed office in January of this year, with 16% more unaffiliateds now indicating their preference for the Republican on a generic ballot (from 29% in February of 2021 to 45% in November of 2021).
White women of all age groups (the largest voting bloc both in North Carolina in the United States) now indicate their preference for a Republican on the generic ballot, with an 11 point shift by white women 18 to 54 years of age (from 38% in February of 2021 to 49% in November of 2021) and a 15 point shift by white women 55 years and older (from 52% in February of 2021 to 67% in November of 2021). Simililarly, there has been a 13 point shift among white women without college degrees (from 50% in February of 2021 to 63% in November of 2021) and an 11 point shift among white women with college degrees toward Republicans (from 35% in February of 2021 to 46% in November of 2021).
The only demographic that has demonstrated a significant shift away from voting for a Republican on the generic ballot are white men over the age of 55: there was a net negative shift of nine points in this group (from 63% in February of 2021 to 54% in November of 2021).

We here at the Carolina Leadership Coalition wish you and your families the peace and joy of the Christmas Season!