By Maggie Smith for the North Carolina Department of Commerce
Introduction
Understanding poverty trends is essential for assessing economic well-being and identifying areas where additional support may be needed. The Small Area Income and Poverty Estimates (SAIPE) program, produced annually by the U.S. Census Bureau, provides county-level poverty data, offering a detailed look at how poverty rates vary across North Carolina. These estimates combine information from the American Community Survey (ACS) and various administrative records to create a reliable measure of poverty at both the state and local levels.
This analysis examines North Carolina’s poverty rate over the past decade, highlighting long-term trends and regional differences. While the state has seen an overall decline in poverty, county-level data reveal disparities. By examining these trends, we can gain a clearer understanding of where progress has been made and where challenges remain.
A Decade of Progress: 2013-2023
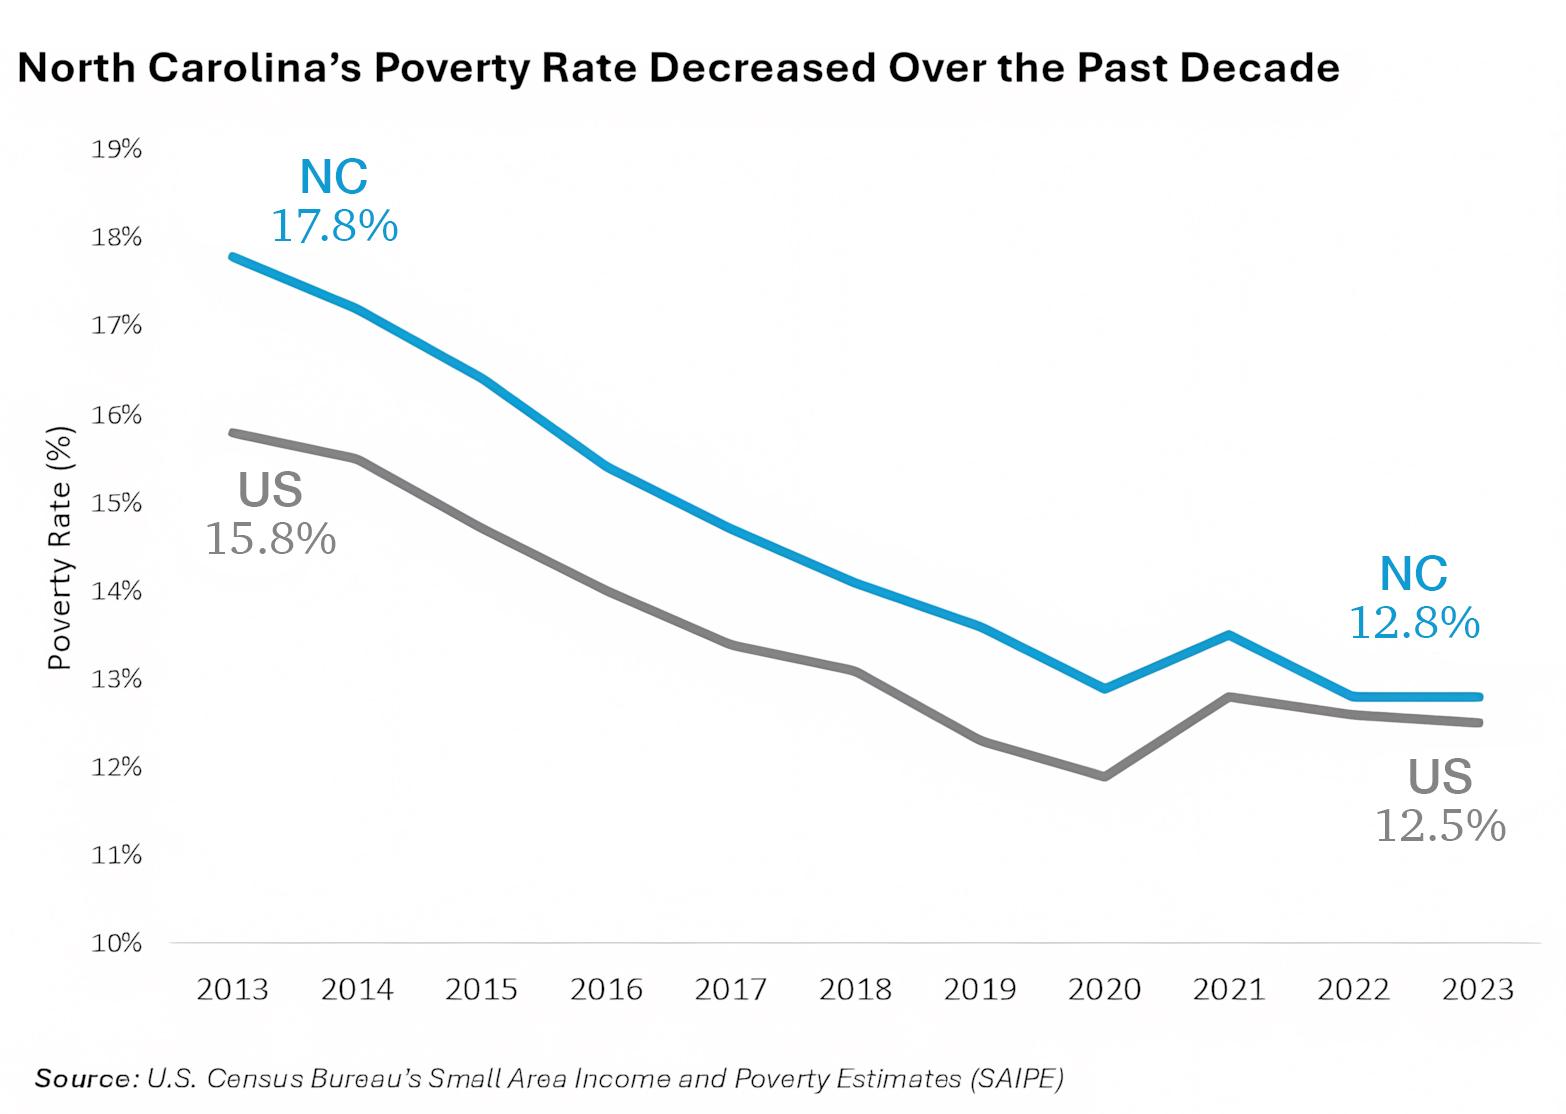
North Carolina’s poverty rate declined from 17.8% in 2013 to 12.8% in 2023, a decrease of five percentage points over the decade (Figure 1). The state’s progress ranks fifth nationwide in poverty reduction during this period, behind Arizona which topped the list with a six-percentage point decrease.
Although the rate rose slightly between 2020 and 2021, disrupting the overall downward trend, the long-term decline has brought North Carolina’s poverty rate closer to the national average of 12.5% in 2023. In 2013, the state’s poverty rate was two percentage points higher than the national rate (17.8% vs. 15.8%), but by 2023, the gap had narrowed to 0.3 percentage points.
As of 2023, approximately 1.35 million North Carolinians were living in poverty, compared to 1.71 million in 2013. This represents roughly 360,000 fewer individuals below the poverty line. While this decline marks meaningful progress, the number of people still experiencing poverty remains substantial, underscoring the ongoing need for attention to economic hardship in the state.
Poverty Rates Vary Widely by County
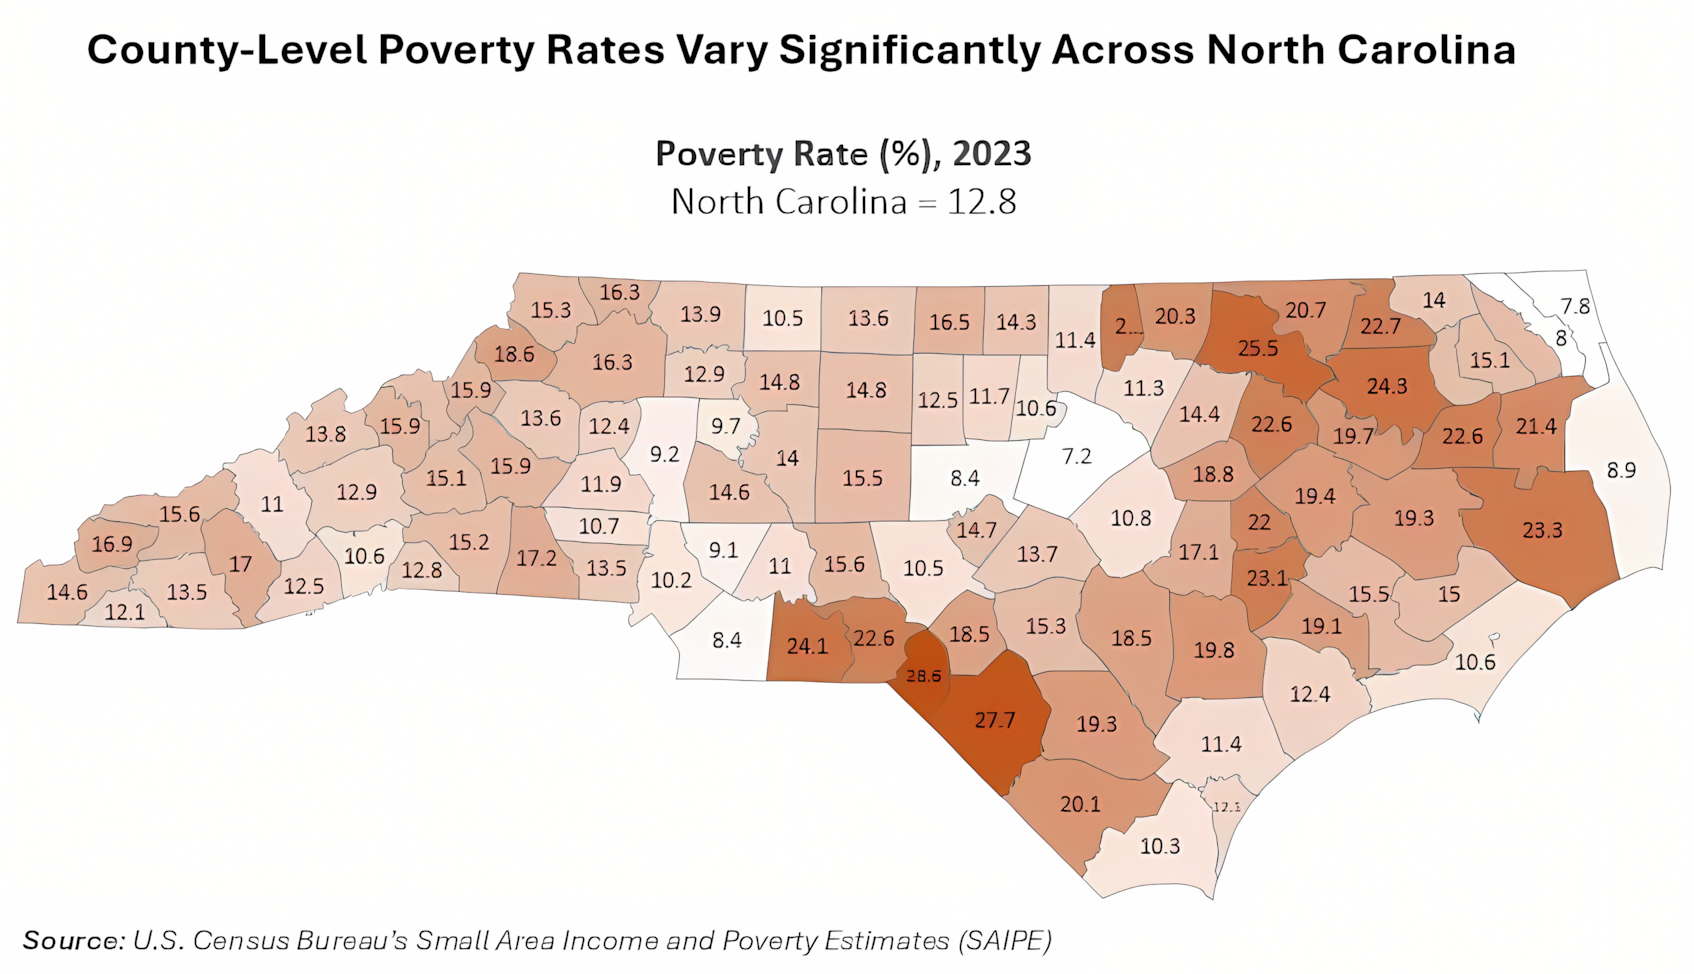
While North Carolina’s overall poverty rate was 12.8% in 2023, county-level data reveals significant disparities across the state (Figure 2). Wake County, home to the state capital, had the lowest poverty rate at 7.2%, while Scotland County was the highest at 28.6%, a gap of more than 20 percentage points. The five counties with the lowest poverty rates were Wake, Currituck, Camden, Union, and Chatham, all with rates below 8.5%. The five counties with the highest poverty rates were Scotland, Robeson, Halifax, Bertie, and Anson, each exceeding 24%. These numbers illustrate the uneven distribution of poverty across North Carolina.
The preceding article originally appeared on February 20, 2025 at the North Carolina Department of Commerce’s website and is made available here for educational purposes only. This constitutes a ‘fair use’ of any such copyrighted material as provided for in Title 17 U.S.C. section 106A-117 of the U.S. Copyright Law. Any views or opinions expressed here are those of the authors and do not necessarily reflect the official policy or position of the Carolina Leadership Coalition.