Demographics and Voting Behaviors
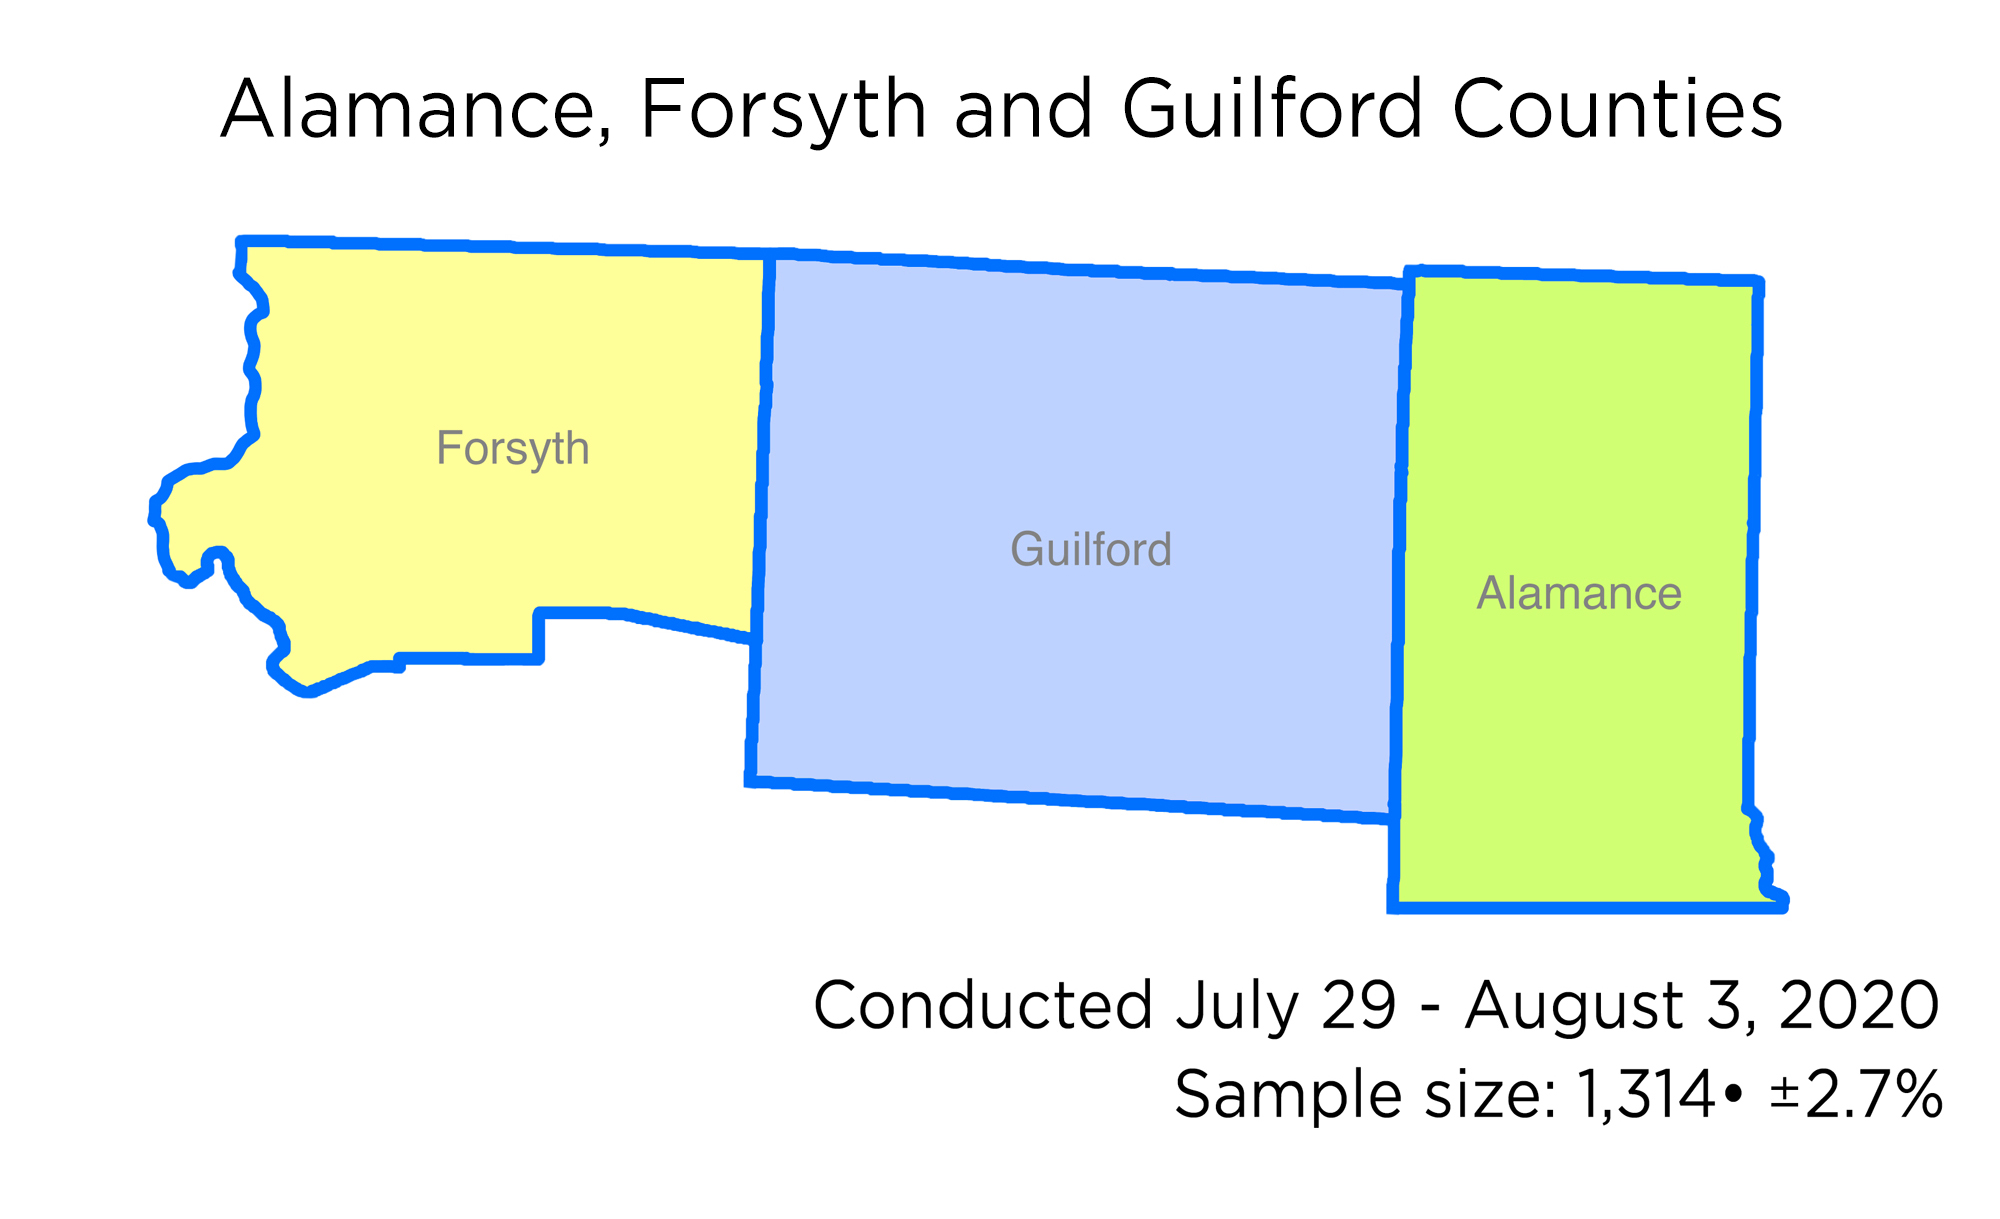
1,314 likely voters (56.2% of whom were female) from three north-central counties in the Triad Region of North Carolina (Alamance, Forsyth and Guilford) were surveyed from July 29 to August 3, 2020. 59.6% were white, 31.9% were black, and 4.2% were Hispanic or Latino.
The age ranges of those under 65 in this group was fairly evenly distributed, with 17.7% being 18 to 34 years old, 21.4% being 35 to 44 years old, 16.8% being 45 to 54 years old, and 18.4% being 55 to 64 years old. Those 65 years old or older comprised just over a quarter of the total, at 25.7%.
A majority of respondents in this tri-county region live in the suburbs, 21.6% live in an urban environment, and just under a quarter (23%) identified as rural voters. Just under a third (30.8%) identified as “suburban women,” a key demographic in the upcoming presidential election.
As is consistent with respondents across the entire state, a large majority of this group (76.2% in this case) reported annual income of $100,000 or less. Nearly a quarter (23.3%) made in excess of $100,000 a year. 66.3% reported having no college degree.
A solid plurality (41%) of these voters are registered Democrats, 32.4% are registered Republicans, 24.8% are Unaffiliated, and 1.7% are registered with a third party. Interestingly, however, is the fact 38.8% of these voters identified as conservatives, 29.4% identify as moderates, and just over a quarter (25.7%) of the total identified as being liberal in their political beliefs. Republicans, like in other parts of the state, overwhelmingly identified as being conservative in their political beliefs at 79.8%. 35.8% of Democrats surveyed identified as moderates and 42.6% identified as being liberals. 37% of unaffilated voters identified as being moderates, while 24.6% identified as being conservatives.
The ideologies of those respondents under 55 years of age were fairly evenly distributed, with 28.3% identifying as conservatives, 31.5% as moderates, and 33% as liberals. A thin majority (52.1%) of those over 55 identified as conservative in their political beliefs, 26.7% as being moderate, and just 16.3% identified as being liberal in their political beliefs.
When asked “If the general election for President were held today, would you vote for Donald Trump, the Republican; Joe Biden, the Democrat; or a third-party candidate,” a majority (52.9%) chose Democrat Joe Biden, 40.4% chose Republican Donald Trump, and 6.7% chose an unnamed, third-party candidate. This tracks closely with voter preferences in the 2018 Congressional elections, wherein 51.1% of voters chose the Democratic candidate and 38.5% of voters chose the Republican candidate. This year, 54.1% of unaffiliated voters prefer Mr. Biden, while 33% prefer Mr. Trump.
A significant majority (60%) of those under 55 intend to cast a ballot for Mr. Biden, while a slight majority (52.4%) of those over 55 intending to cast a ballot for Mr. Trump.
A significant majority of women (59.2%) in the Triad region intend to cast their vote for Mr. Biden, while men are fairly evenly split between Mr. Biden (44.9%) and Mr. Trump (47.6%). Similarly, “suburban women” break for Mr. Biden by a two-to-one margin.
Self-identified moderates in the Triad region overwhelmingly intend to vote for Mr. Biden, at 71.3%.
Those reporting an annual income of more than $100,000 are evenly split between Mr. Trump (47.4%) and Mr. Biden (47.9%). A majority of voters making less than $50,000 a year (57.8%) support Mr. Biden, and 40.2% of those making between $50,000 and $100,000 support Mr. Trump, while 51.9% support Mr. Biden.
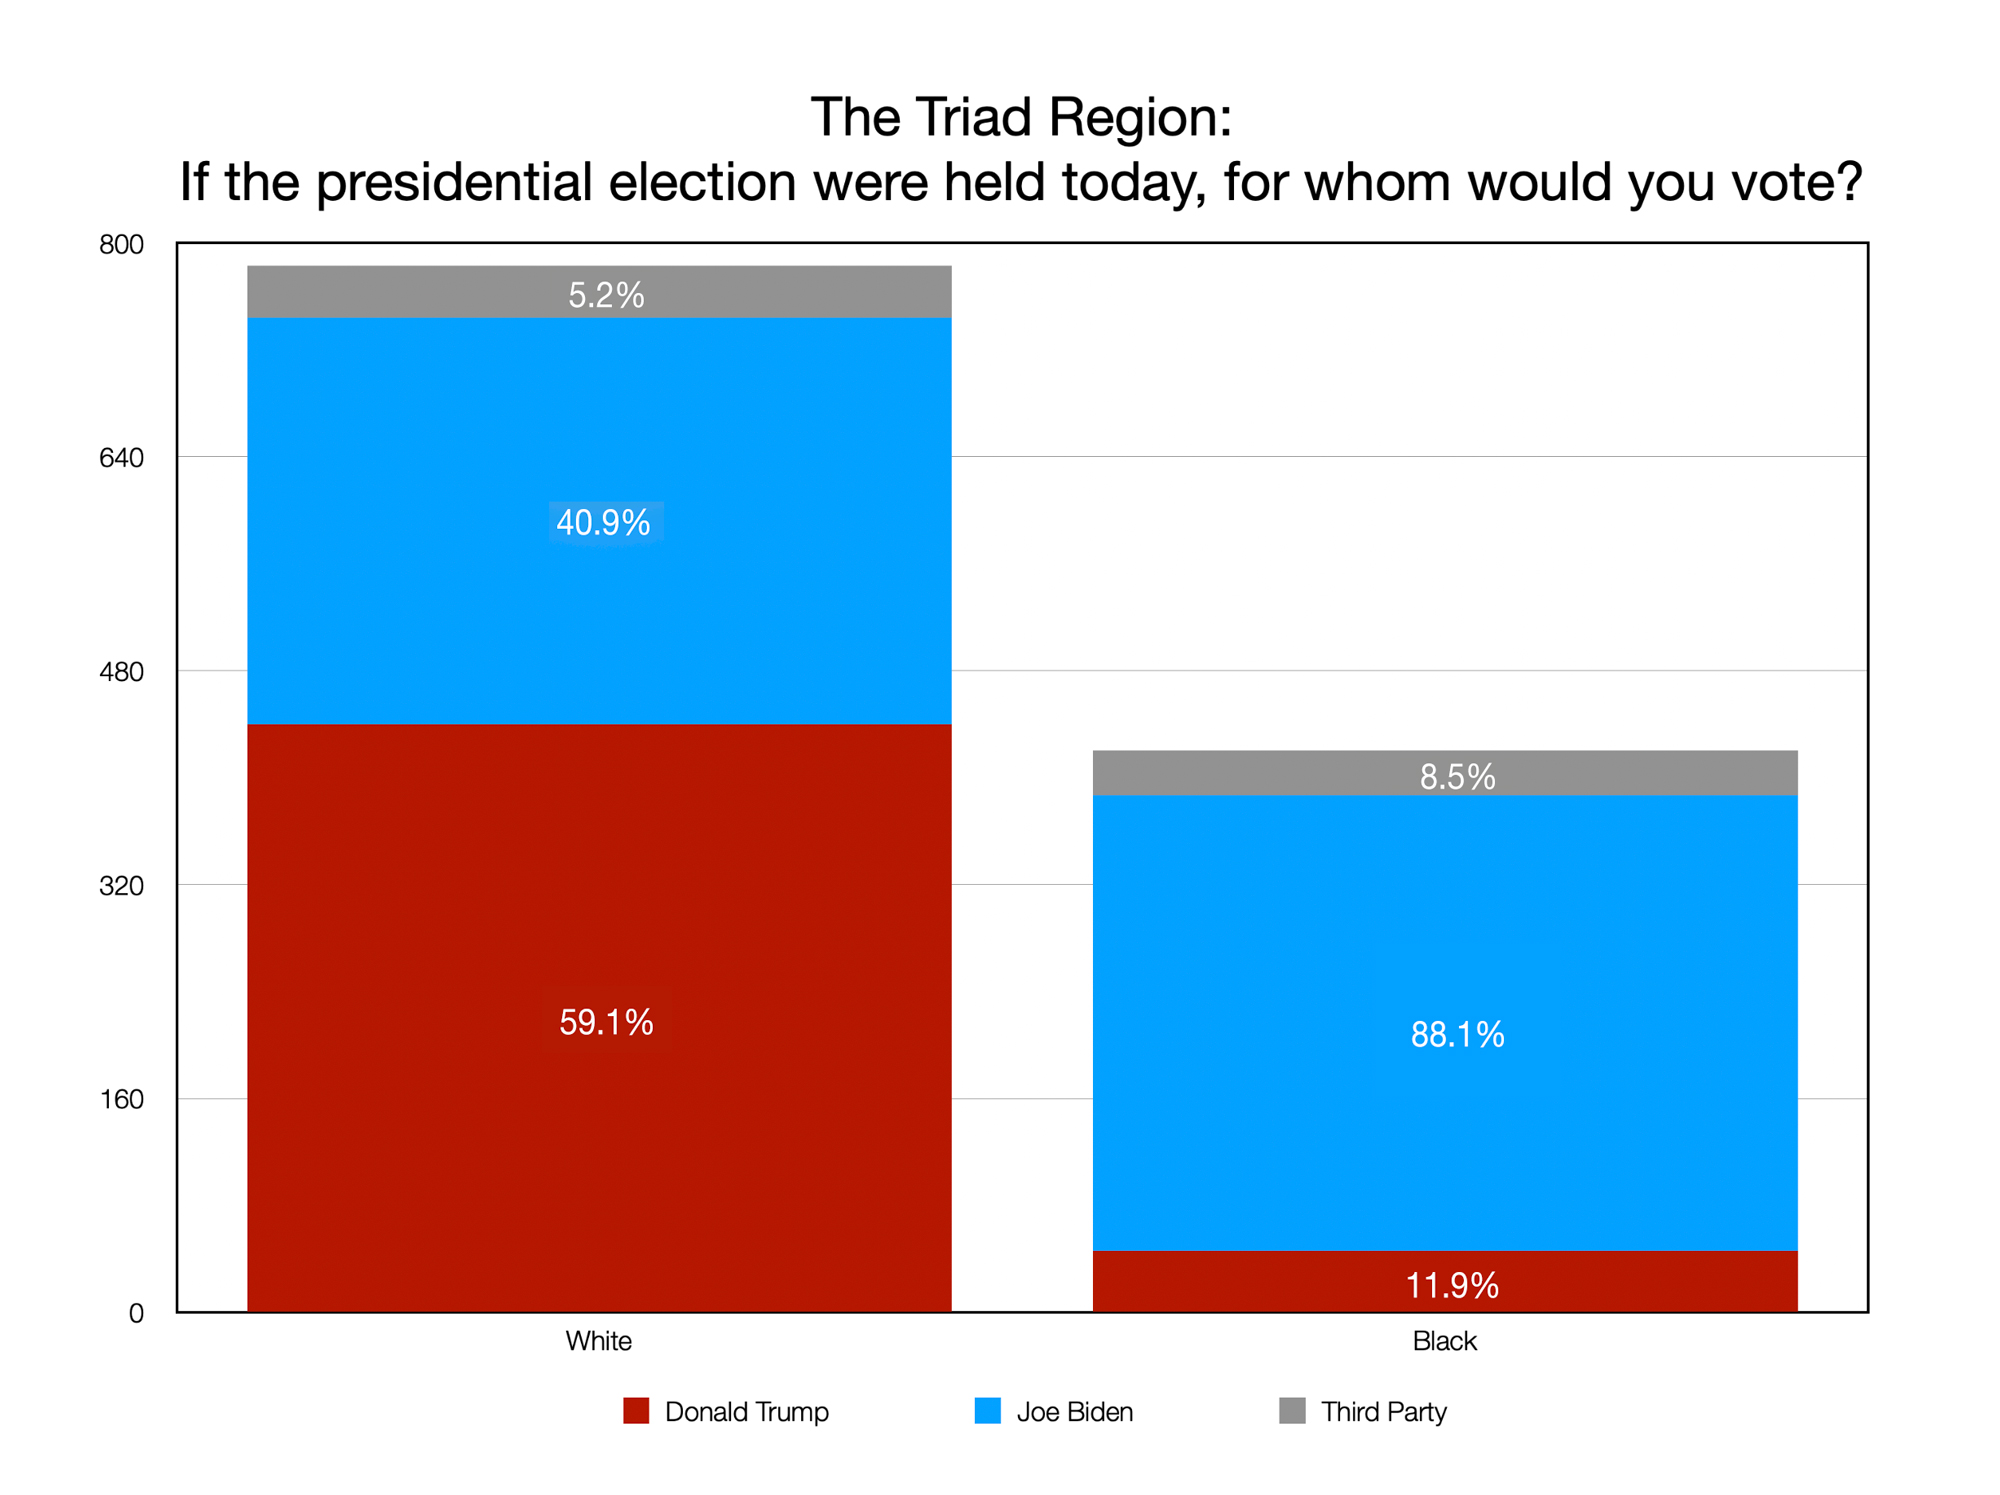
Interestingly, 11.9% of black voters in the Triad Region (with the second highest percentage of blacks surveyed in the state), intend to cast their vote for Mr. Trump. The Mountain Region’s percentage of black citizens intending to vote for Mr. Trump is slightly higher at 12.5% (but that region also has the lowest percentage of black voters among the four regions surveyed). A full one-third of Hispanic and/or Latino voters support Mr. Trump and he also garners a majority of Asian-American support (53.8%).
The Coronavirus Pandemic
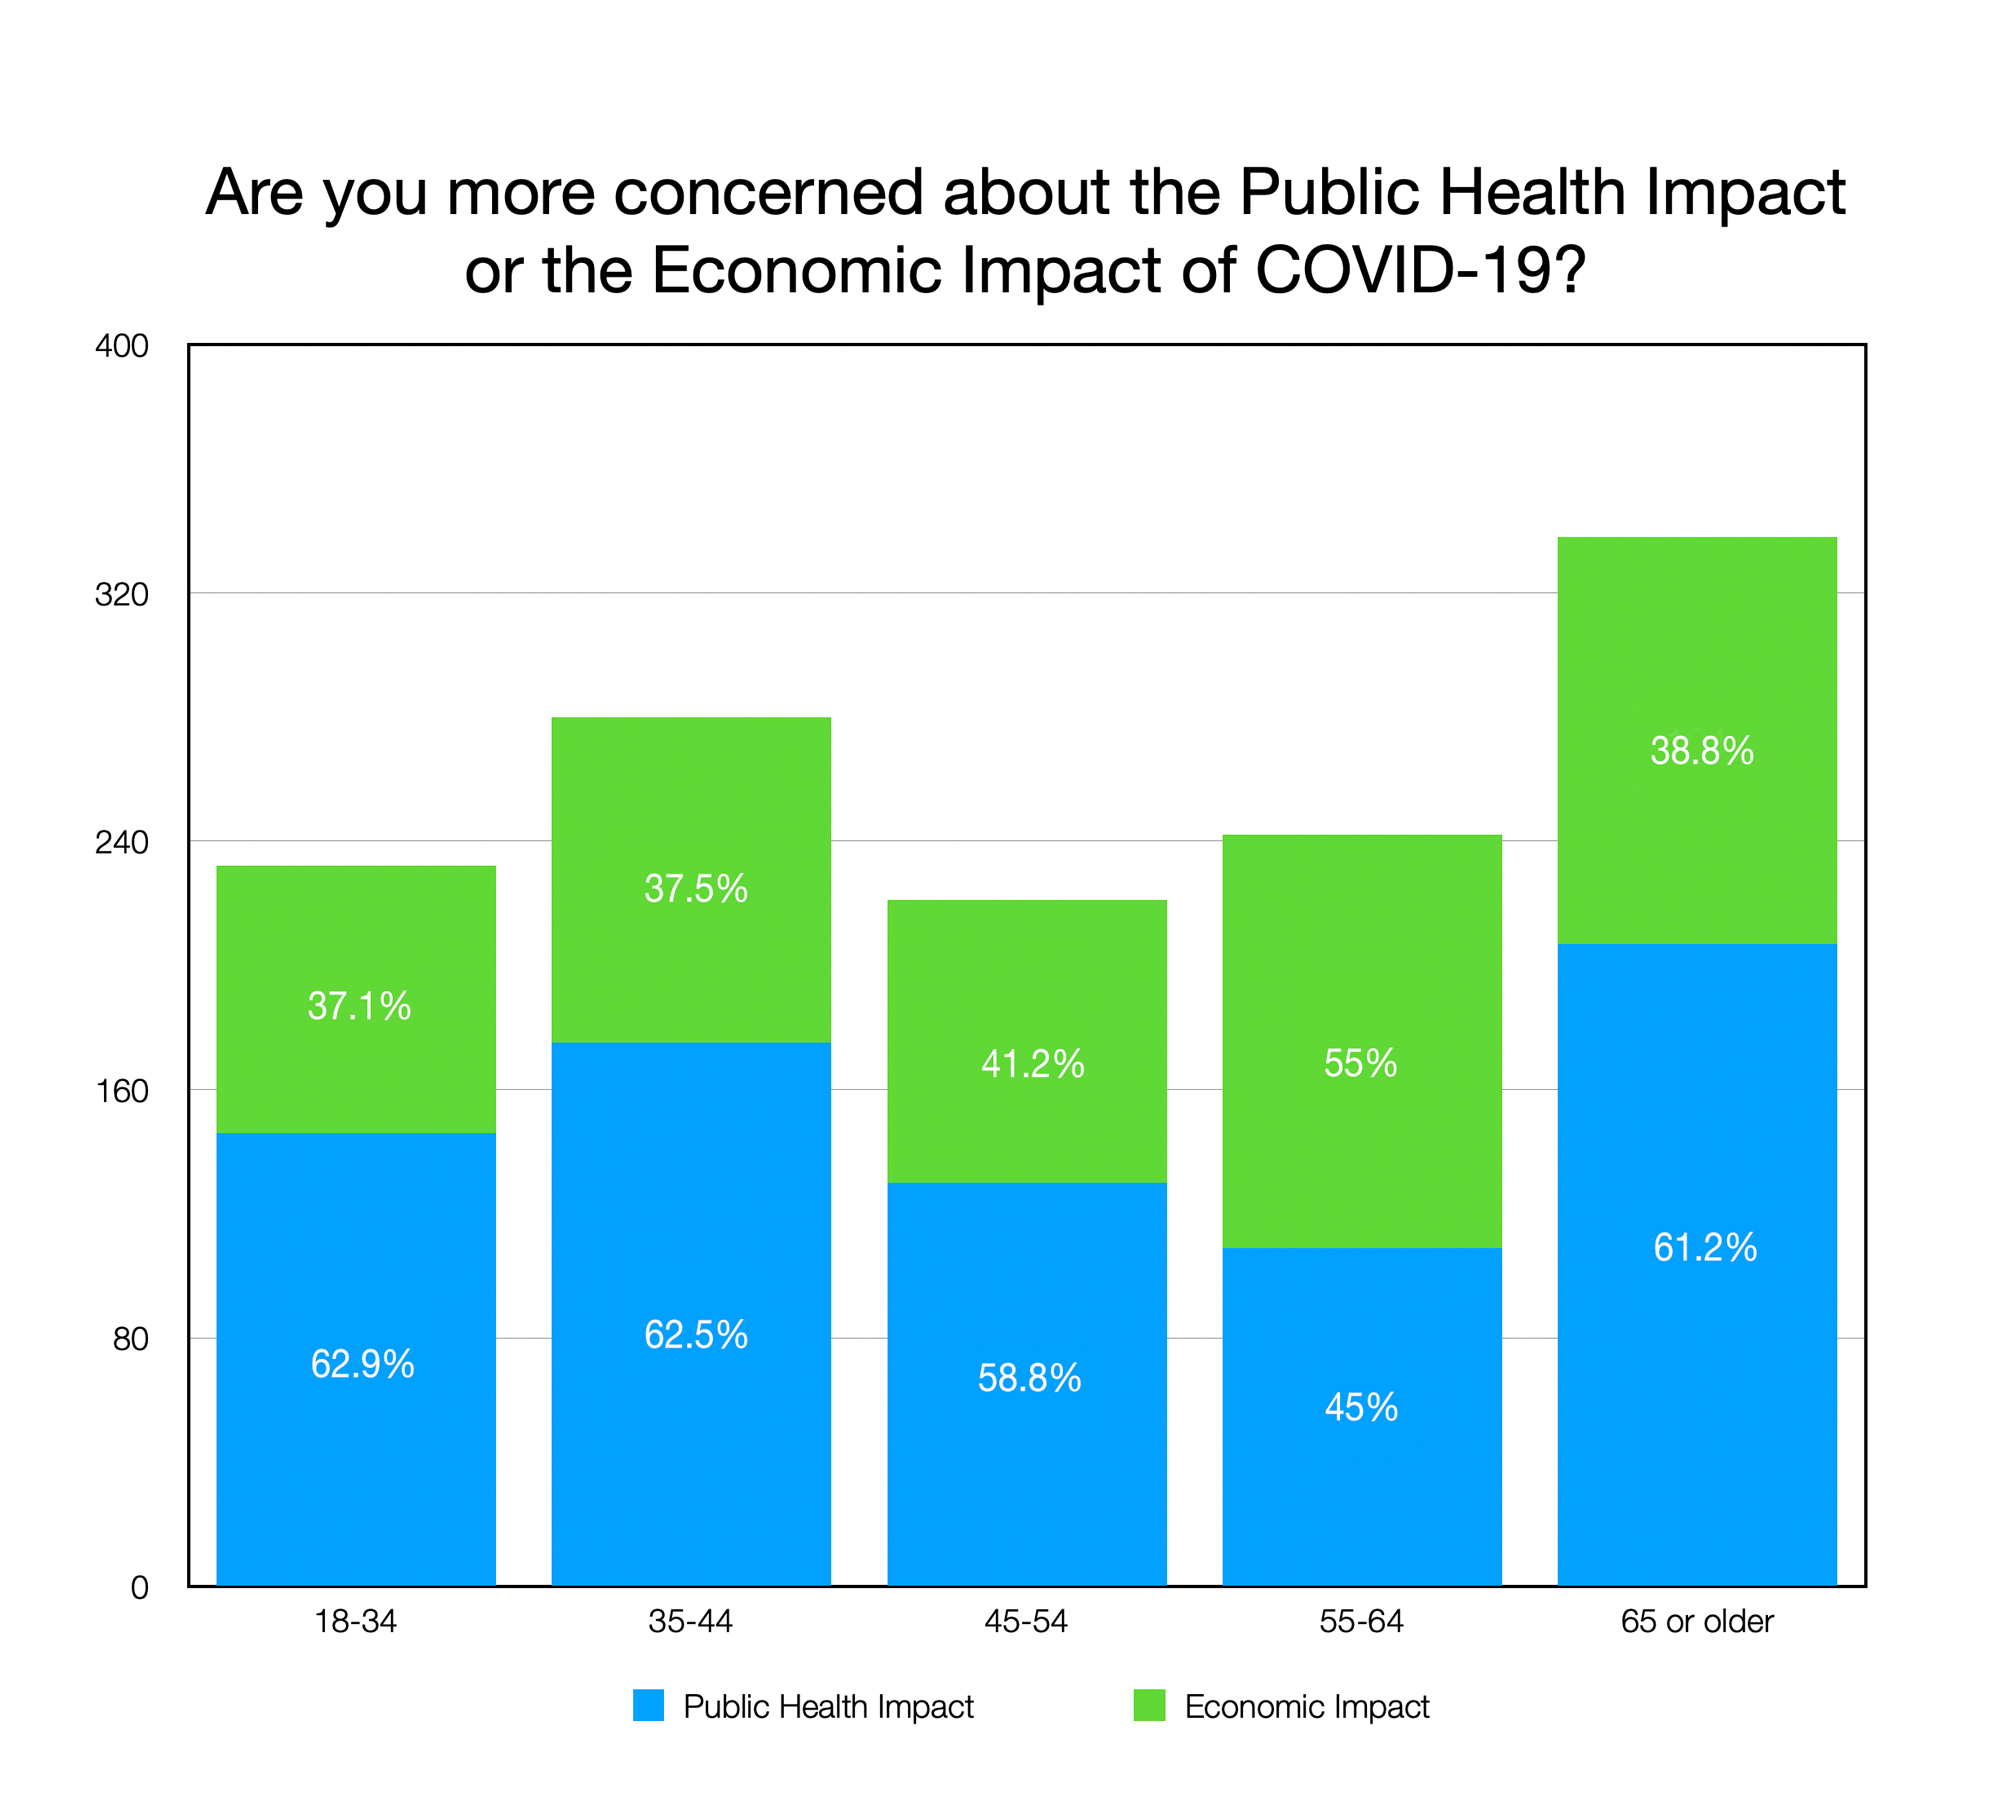
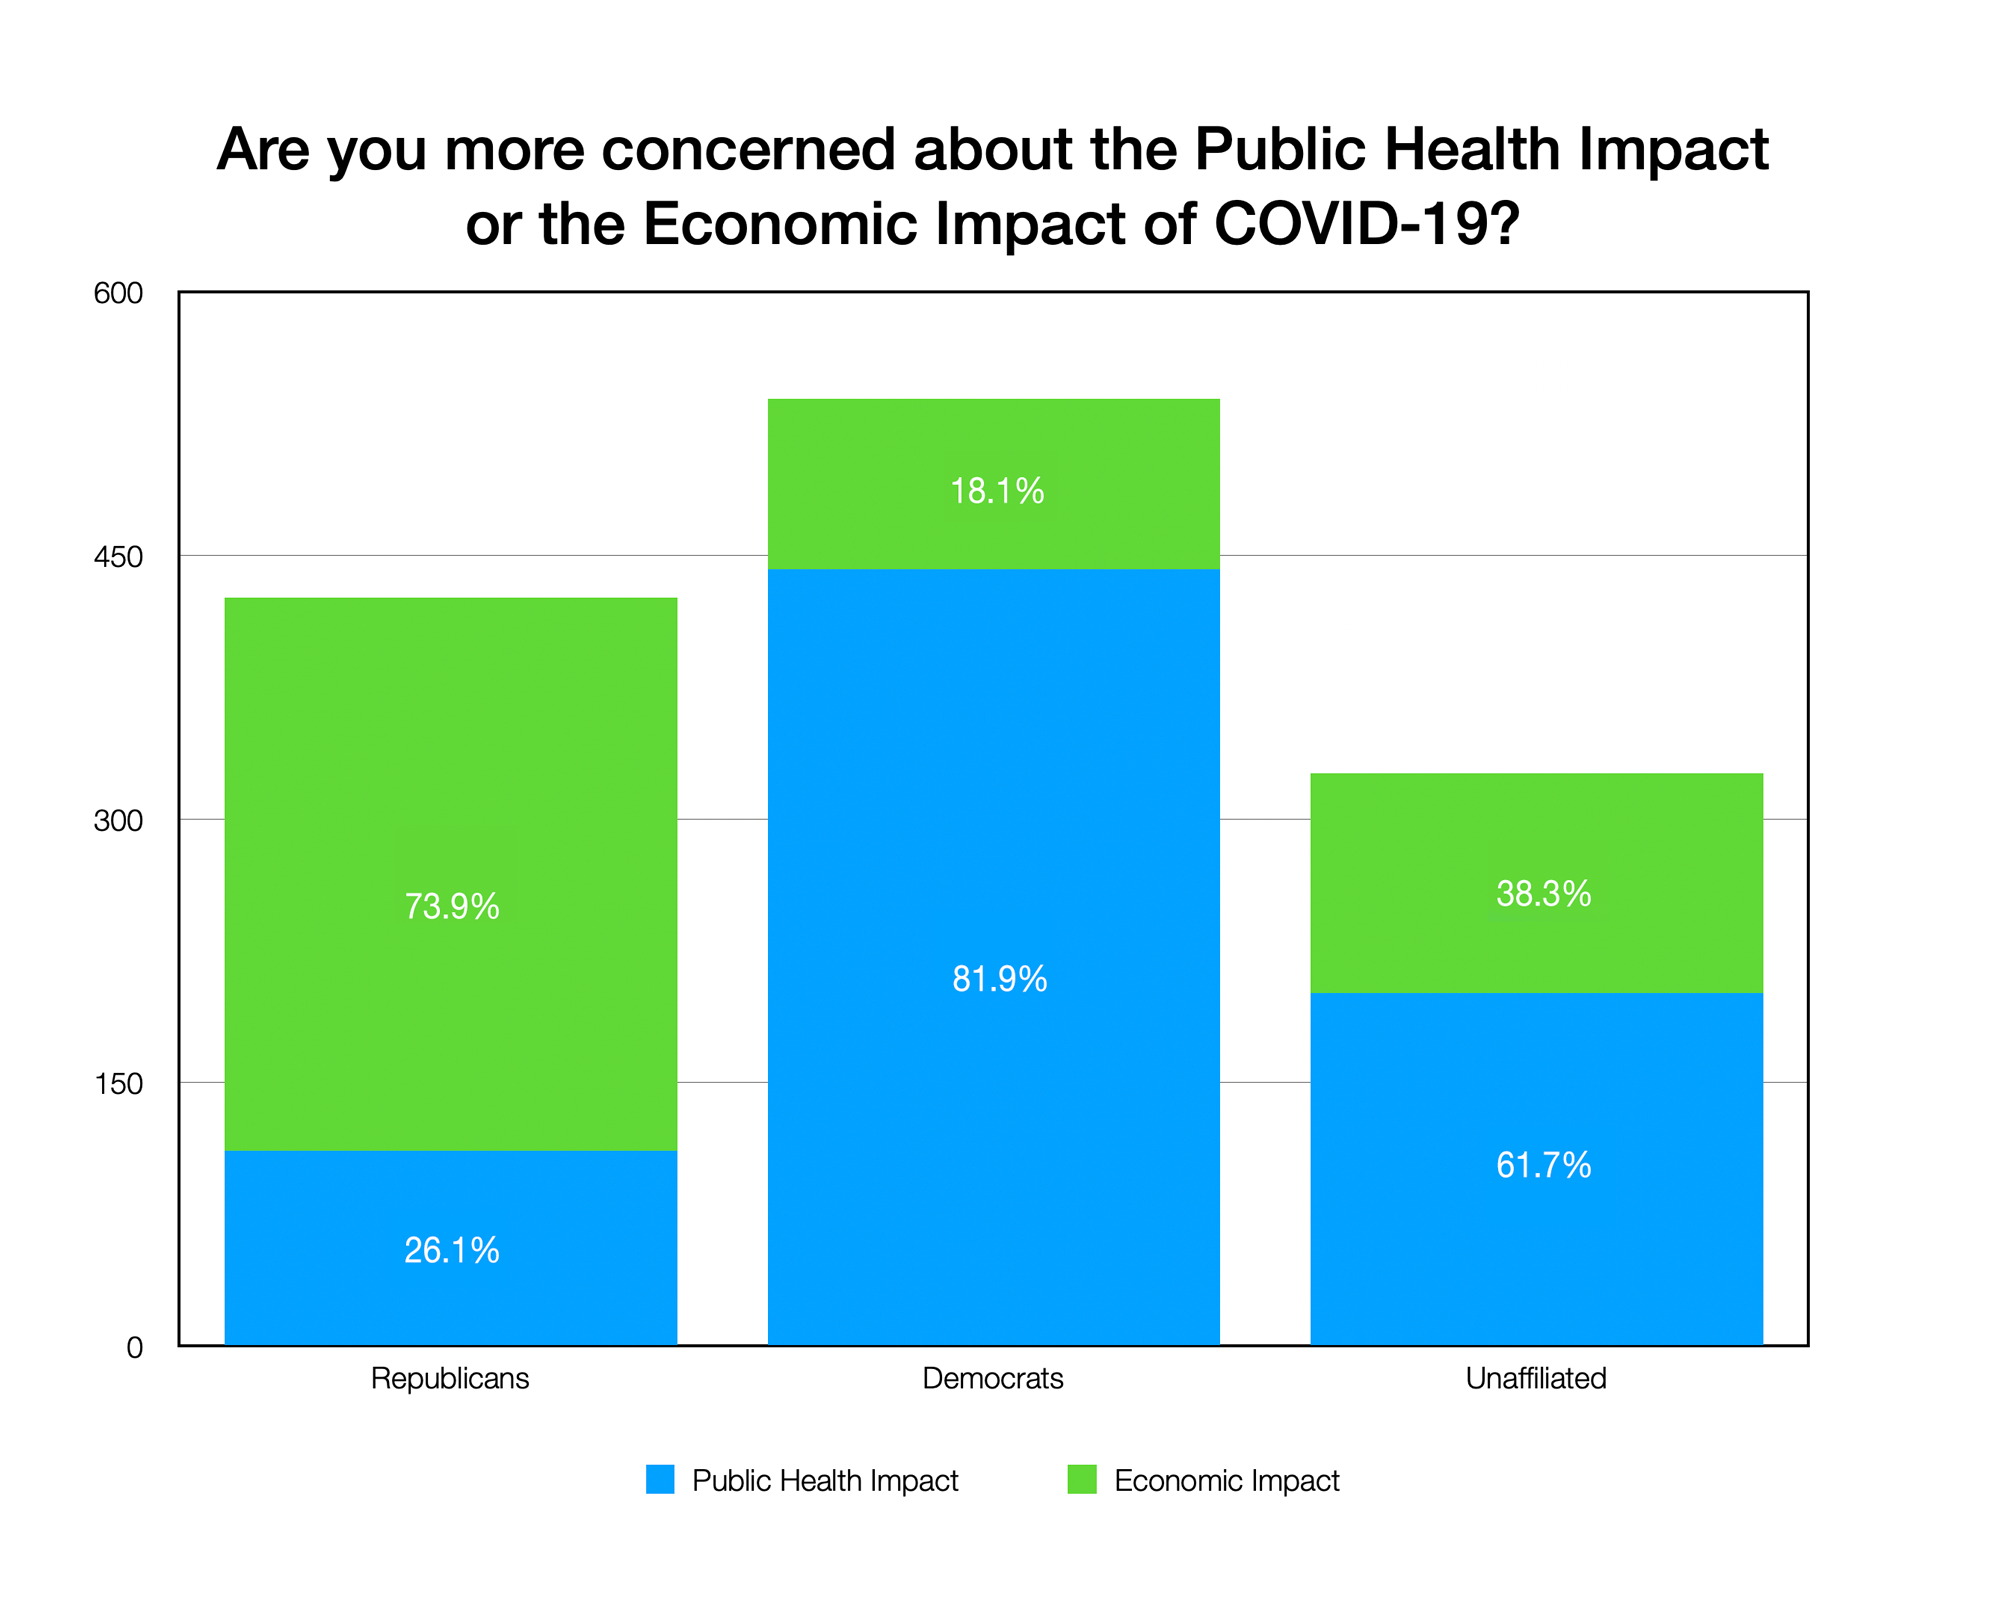
A majority (58.4%) of survey respondents in the Triad Region felt that the public health impact of the COVID-19 pandemic was of greater concern than was its economic impact. When broken down by age, significant majorities existed in almost all ranges who felt that the public health impact was of greater concern; only those between the ages of 55 and 64 felt the economic impact was of greater concern.
As with other regions in the state, Republicans and Democrats are sharply divided over the question. While 81.9% of Democrats felt that the impact on public health was of greater concern than was the impact on the economy, 74% of Republicans felt that the impact on the economy was greater. Significant majorities of Unaffiliated (61.6%) and third-party (60%) voters felt that the public health impact outweighed the impact on the economy.
Not surprisingly, 69.8% of self-identified conservatives are more concerned with the economic impact of the virus than they are the public health impact, while 84.8% of self-identified liberals are more concerned with its public health impact. 69.7% of self-identified moderates said the impact on public health was of more concern.
Voters who identified as rural felt the public health impact of the pandemic outweighed that of the economy, but only by a small margin of 5.6%. Suburban and urban voters felt that the public health impact of the pandemic outweighed that of the economic impact at 58.5% and 63.9%, respectively.
A large majority of respondents (74%) from every age range surveyed said that they would support a government-enforced mask mandate that would require everyone to wear face coverings in shared public spaces. Democrats would support this restriction by 95.4%, Women by 79%, Suburban Women by 81.2%, Blacks by 92.5%, Hispanic and/or Latinos by 84.9%, and Asian-Americans by 92.4%.
Republicans were more evenly split, with 46.4% saying that they would support a government-enforced mask mandate and 53.6% saying that they would oppose it.
On the ideological spectrum, only those who identified as “very conservative” constituted a majority of those who opposed a government-enforced mask mandate. Those who identified as “somewhat conservative” by 57.6%, those who identified as “somewhat liberal” by 96.3%, and those who identified as “very liberal” supported a government-enforced mask mandate by 94.3%.
A majority of those surveyed (60.3%) also said that they disagree that schools should be open for any face-to-face instruction in the fall (considering the current status of the coronavirus pandemic in North Carolina), including 66.5% of women and 52.4% of men.
Significant majorities of respondents 18 to 34 (67.2%), 35 to 44 (66.7%), and 45 to 54 (64.4%) all disagreed that schools should be open for any face-to-face instruction in the fall, while slimmer majorities of those 55 to 64 years of age (51.6%) and 65 years or older (53.9%) disagreed that schools should be open for any face-to-face instruction in the fall.
76% of Republicans surveyed believed that schools should be open for at least some level of face-to-face instruction in the fall, while 85.3% of Democrats surveyed said they they disagreed that schools should be open for any face-to-face instruction in the fall.
Similarly, 69.8% of those who identified as “very conservative” and 61.5% of those who identified as “somewhat conservative” believe that schools should be open for at least some level of face-to-face instruction in the fall, while 87.2% of those who identified as “very liberal” and 91.1% of those who identified as “somewhat liberal” said that they disagreed that schools should be open for any face-to-face instruction in the fall.
A 52.1% majority of white respondents believed that schools should be open for at least some level of face-to-face instruction in the fall, while an overwhelming majority of black respondents (82.8%) said that they disagreed that schools should be open for any face-to-face instruction in the fall.
Protests
When the following question was asked:
Thinking about the recent killing of George Floyd by a white police officer, do you support or oppose the protests that have happened across the country as a result?
61.2% of the women surveyed in the Triad Region supported the protests (with a slightly higher majority of self-identified “suburban women” supporting them at 62.3%), while a smaller majority of men (at 56.7%) supported the protests. Those under the age of 55 overwhelmingly supported the protests (at a 70.9% mean rate), while a small majority of those 55 years and older opposed them at 55.5%.
Black voters in the Triad Region overwhelmingly support the protests, at 87.1%. A majority of 56% of white voters oppose them.
A 62.9% majority of those making an annual income of less than $50,000 support the protests. 58.9% of those making an annual income over $50,000 but less than $100,000 support the protests, and those reporting an annual income of $100,000 or more support the protests by 54.5%.
Similarly, varying majorities support the protests across all educational levels.
84% of Republicans opposed the protests, while 89.6% of Democrats and 65.7% of Unaffiliated voters supported them. A slim majority (52.9%) of rural voters opposed the protests, while urban and suburban voters approved of them, at 72% and 59.2%, respectively.
Defunding the Police
When the following question was asked:
Do you support or oppose the idea of defunding the police by taking away resources used for law enforcement and diverting them to other services?
Voters across nearly every demographic group oppose defunding the police by taking away resources used for law enforcement and diverting them to other services. Women oppose defunding the police by 62.8%, men by 68.5%, whites by 76%, Hispanic and/or Latinos by 60.7%, Asian-Americans by 68.9%, rural voters by 74.6%, suburban voters by 64.5%, and urban voters by 57.2%.
Additionally, 96.7% of Republicans oppose defunding the police and 64.8% of moderates oppose defending the police. People across all income levels also overwhelming oppose defunding the police by taking away resources used for law enforcement and diverting them to other services.
However, 54.2% of blacks surveyed in the Triad Region support defunding the police, as well as a majority of those between the ages of 18 and 34 (at 52.9%). Those respondents who self-identify as “somewhat liberal” support defunding the police by 67.5%, and those identifying as “very liberal” support defunding the police by an overwhelming 78%.
This is the second article in a series of four that will summarize the findings of polls commissioned by the Carolina Leadership Coalition over the summer. These polls were conducted by an award-winning national public opinion and predictive analytics firm which surveyed likely general election voters in four discrete geographic regions of North Carolina. Download the full model results for the Triad region here.