Demographics and Voting Behaviors
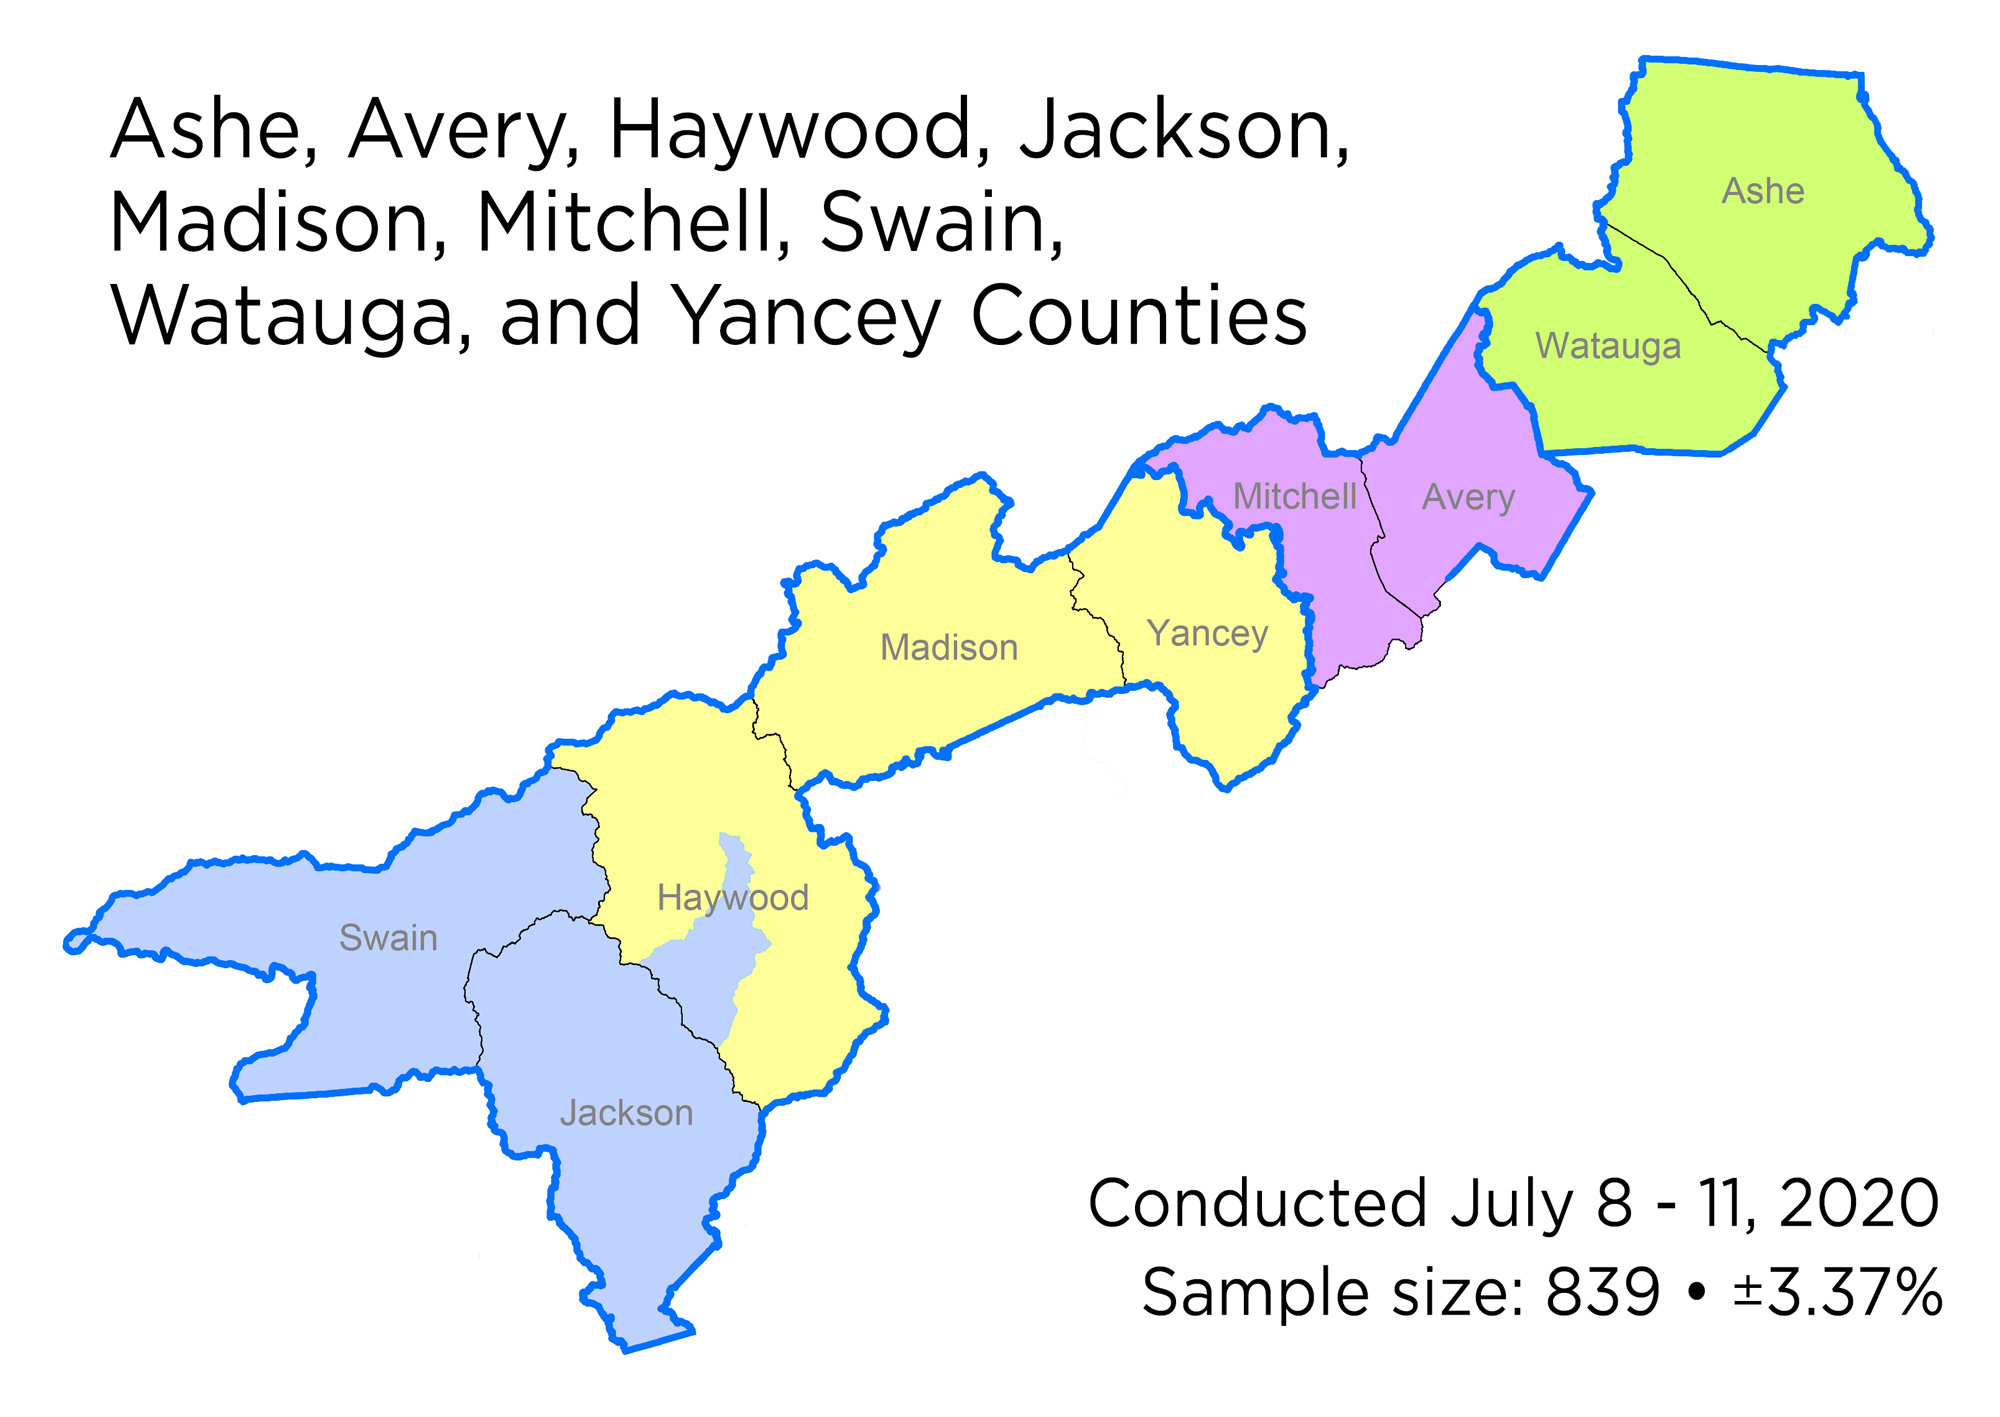
839 likely voters (53.5% of whom were female) from nine western counties (Ashe, Avery, Haywood, Jackson, Madison, Mitchell, Swain, Watauga, and Yancey) were surveyed from July 8 to July 9, 2020. As a group, they were whiter (89.0%), older (52.1% over age 55), more rural (80.5%), and contain, relative to the three other regions surveyed, the lowest percentage (7.8%) of those identifying as “suburban women,” a key demographic in the upcoming presidential election.
As is consistent with respondents across the entire state, a large majority of this group (74.2% in this case) reported annual income of $100,000 or less. However, this group reported the lowest percentage of those making in excess of $100,000 a year, at 17%.
Similarly, a large majority of this group (72.7%) reported having no college degree. This rate tracks closely with those surveyed in other parts of the state, falling below just 1.3% of the median score.
A solid plurality (38.6%) of these voters are registered Republicans (32.6% are registered Democrats, 26.3% are unaffiliated, and 2.5% are registered with a third party), and an even greater plurality (45.7%) are conservative in their political views, with 22.1% identifying as “somewhat conservative” and 23.5% identifying as “very conservative.” Liberal respondents comprised 32.2% of the total; 16% identified as “somewhat liberal” and 16.2% identified as “very liberal.” Unaffiliated voters span the ideological spectrum in roughly equal numbers, with a slight advantage (within the margin of error) going to those identifying as “somewhat conservative.” Of the four regions surveyed, these mountain voters had the lowest percentage of self-identified moderates (19.9%).
When asked “If the general election for President were held today, would you vote for Donald Trump, the Republican; Joe Biden, the Democrat; or a third-party candidate,” a slim majority (50.9%) chose Republican Donald Trump, 42.6% chose Democrat Joe Biden, and 6.6% chose an unnamed, third-party candidate.
These percentages correlate almost exactly with the party affiliation of the candidate for whom they voted in the 2018 general congressional election, with 50.4% voting for the Republican congressional candidate and 42.2% voting for the Democratic congressional candidate.
57.2% of men surveyed in the mountain region intend to cast their vote for Donald Trump, while 36.2% intend to cast their vote for Joe Biden. Mr. Biden wins the female vote with 48.1% to Mr. Trump’s 45.4%.
Mr. Trump won in each age group but those who are 18 to 34 years old (with 51.6% intending to vote for Mr. Biden) and those over 65, where Mr. Biden garners 49.9% to Mr. Trump’s 48% (note: this is within the poll’s margin of error).

As is the case across the state, an overwhelming percentage of the respondents have voted frequently in the past, with 95.4% indicating that they always vote or vote most of the time. Enthusiasm (“general voter propensity”) favors Mr. Trump, with 55.1% of his voters reporting a high propensity to vote, while 41.1% of Biden voters report a high propensity to vote.
Voters of all kinds from across the state already have their minds made up when it comes to for whom they will vote, with the mountain region leading the way. In the presidential race, just 7.5% there are undecided; in the congressional race, 20.5% are undecided; and in the elections for state legislature, 24.9% are undecided.
One will take note of the significant difference between the percentage of those undecided in the upcoming race for president and those in the so-called “down ballot” races — more than double for the congressional race and more than triple for state legislature. In a future post, we will examine who these voters actually are.
And, finally, like their counterparts surveyed in the other parts of the state, a near-majority (47.5%) plan to vote early, while 40.7% plan to vote on election day and 11.8% plan to vote absentee by mail.
The Coronavirus Pandemic
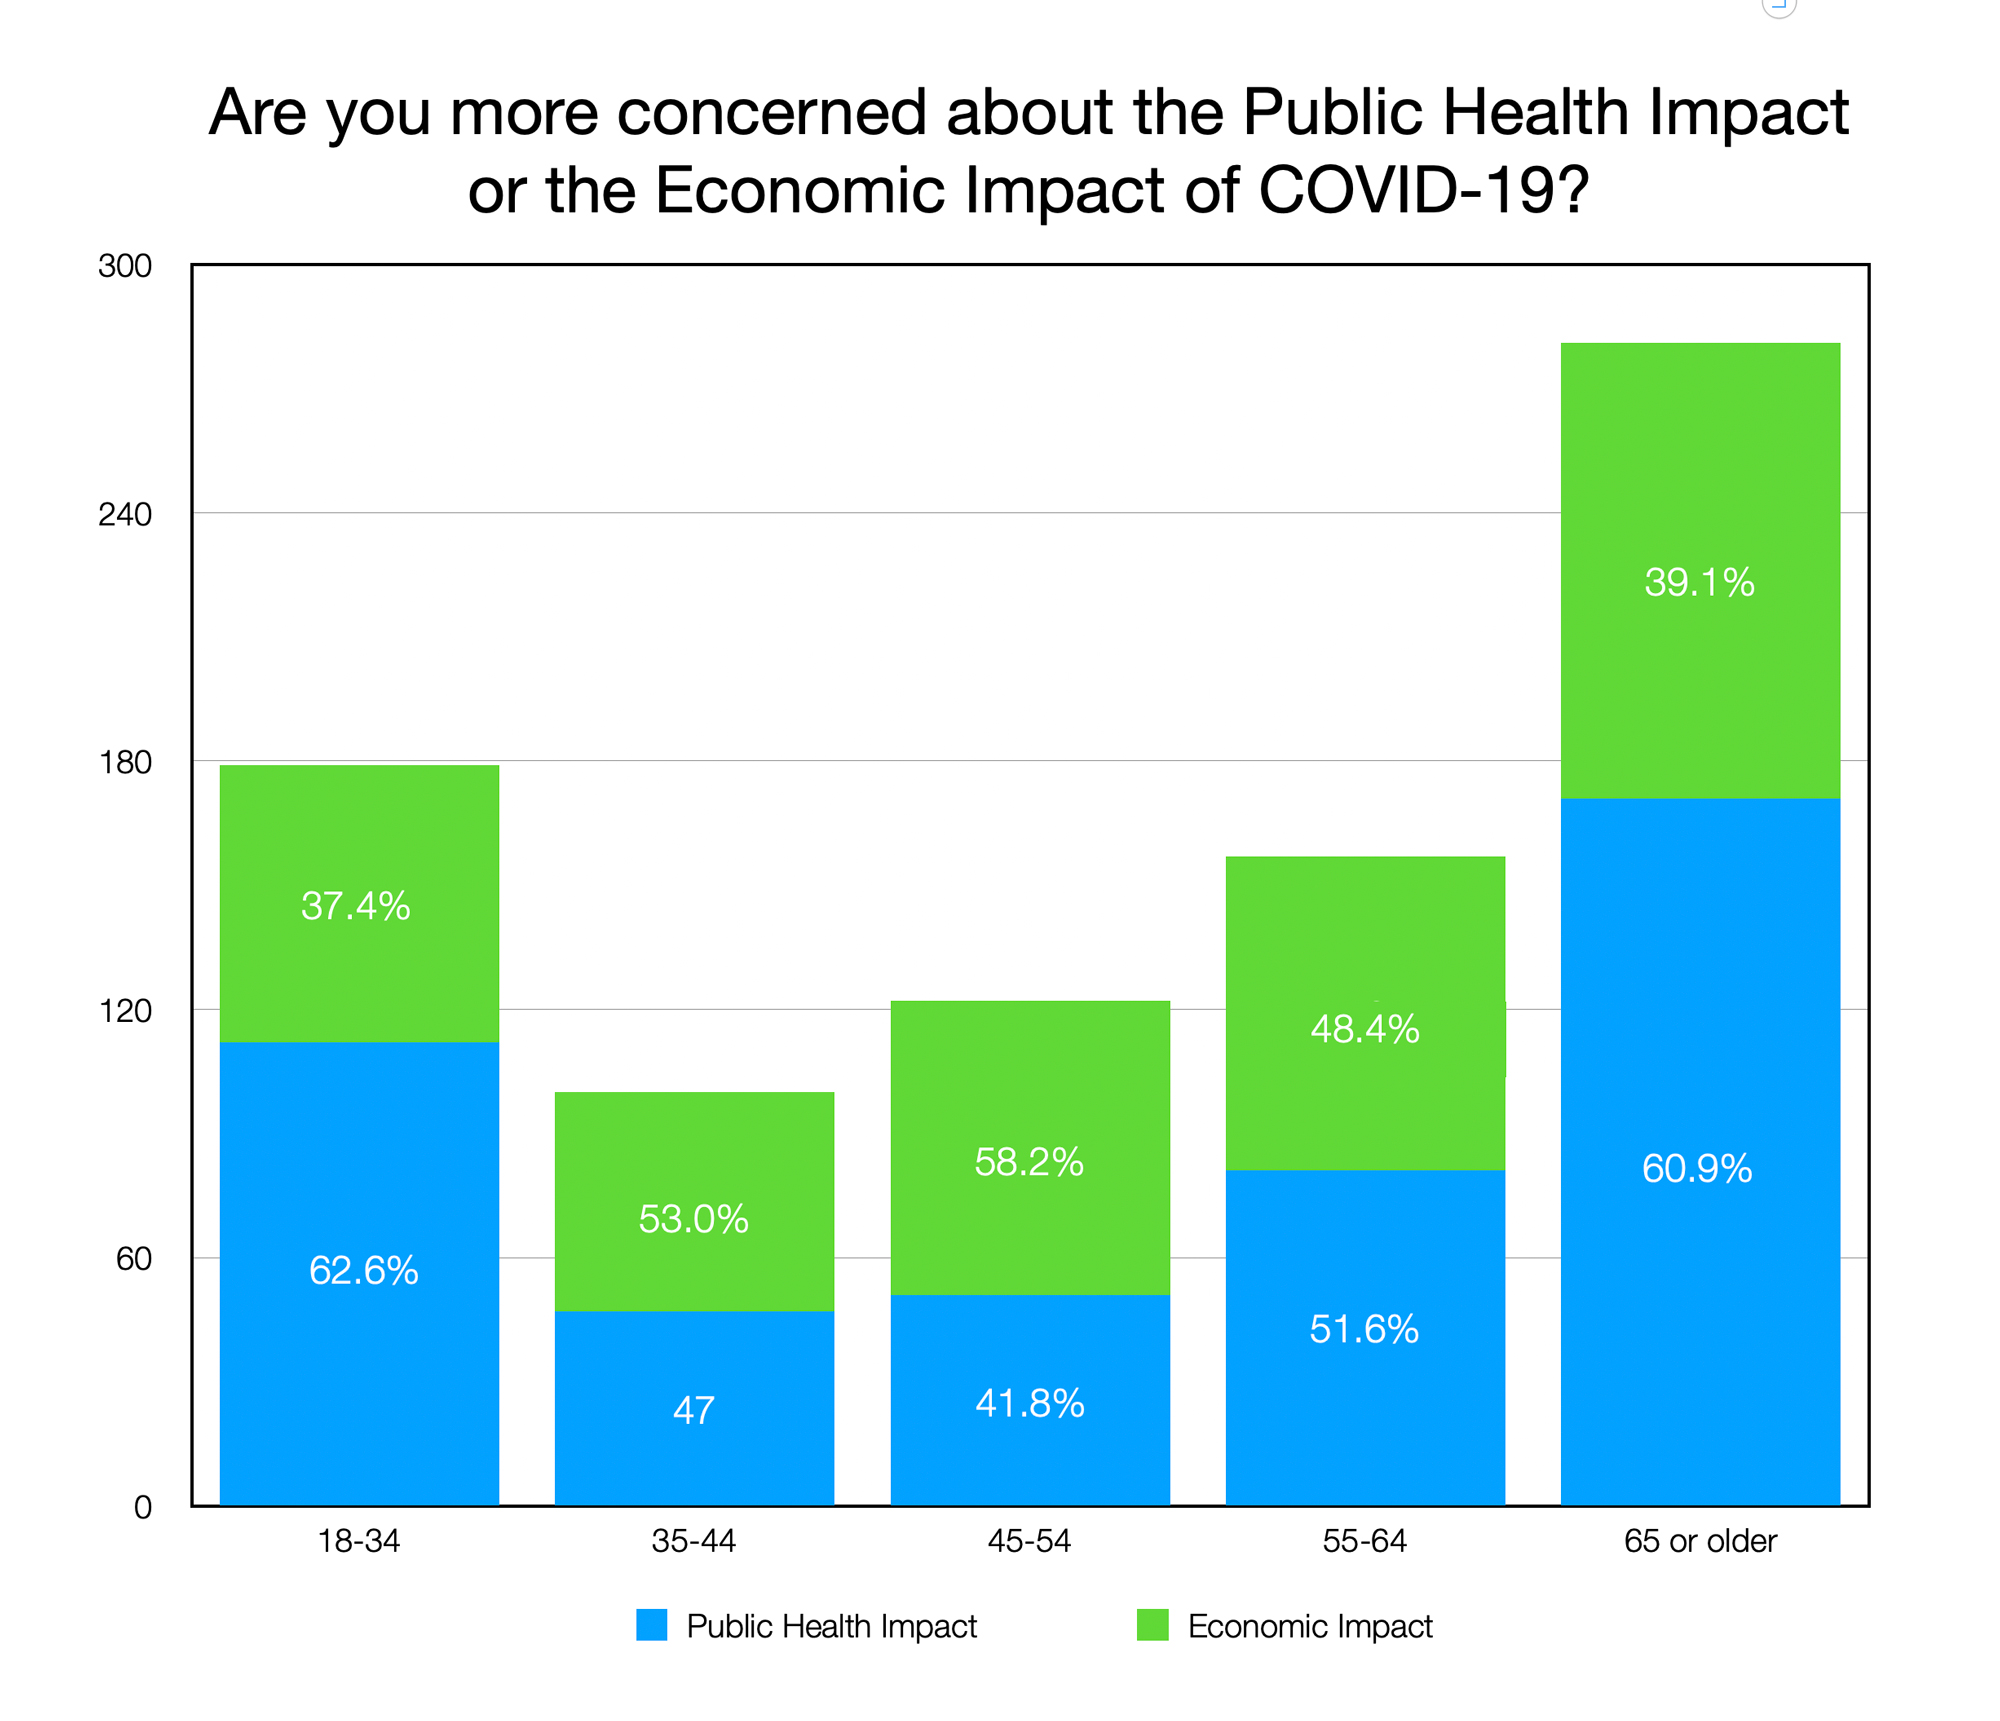
55.1% of respondents in the mountains were more concerned about the public health impact of COVID-19 than the economic impact of the virus, with sizable majorities among 18 to 34 year olds and those 65 or older. Among those 55 to 64 years old, the gap shrinks (51.6% to 48.4%) to within the statistical margin of error. Among those respondents 35 to 54 years old, the economic impact of COVID-19 represented more of a concern than the public health impact.
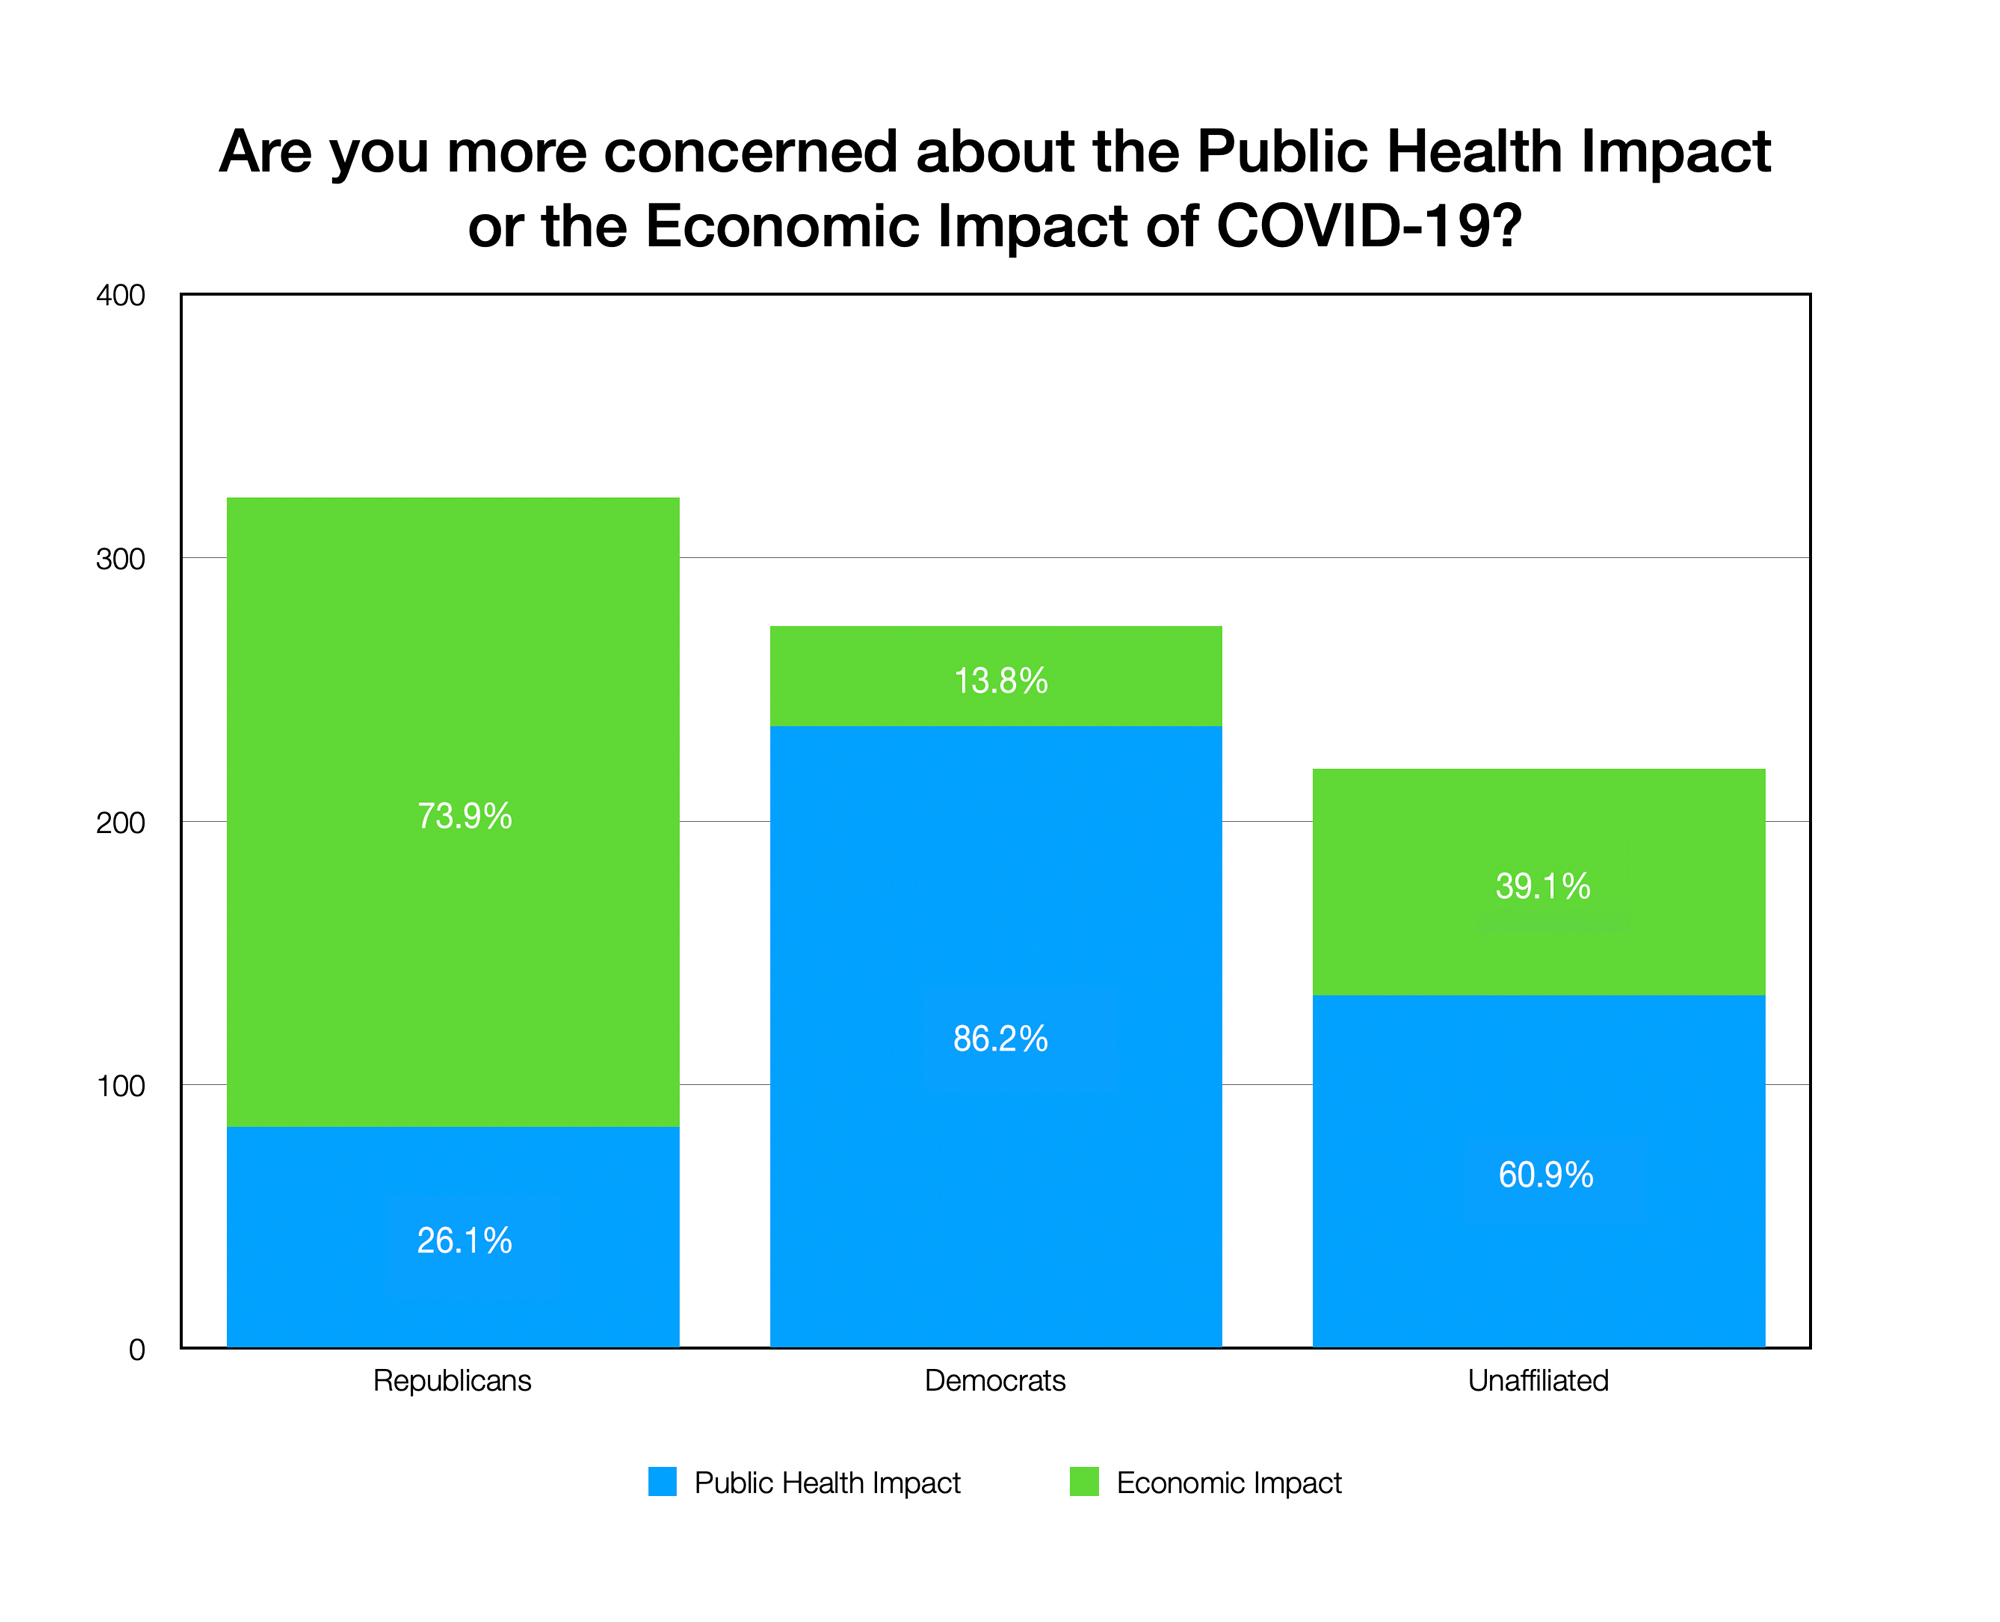
Examined by party, one observes an almost total inversion of opinion on the question: 73.9% of Republicans are more concerned about the economic impact of the virus than they are the public health impact, while 86.2% of Democrats are more concerned with its public health impact; just 13.8% of Democrats are more concerned with the economic impact of COVID-19. Unaffiliated voters are more evenly split, with 60.9% saying they are more concerned with the public health impact of COVID-19 than its economic impact.
Similarly, 76.9% of self-identified conservatives are more concerned with the economic impact of the virus than they are the public health impact, while 92.2% of self-identified liberals are more concerned with its public health impact. Just 13.8% of Democrats are more concerned with the economic impact of COVID-19. 69.97% of self-identified moderates said the impact on public health was of more concern.
Interestingly, there is no statistical difference on this question between respondents who otherwise identified as rural, urban, or suburban voters.
Similarly, there was no statistical difference among voters with different educational levels. They were essentially evenly split on the question: of those respondents who only attained a high school diploma or did not graduate high school, 53.1% said that the public health impact of the virus was the greater concern; of those with some college, 50.6% agreed; and of those with a bachelor’s or more advanced degree, 52.1% agreed that the public health impact was more important.
44.1% of total respondents feel that the North Carolina General Assembly has not done enough to respond to the public health effects of the coronavirus pandemic, with 32% saying it has done enough, and 23.9% feel it has done too much.
When the following question was asked:
In response to the coronavirus outbreak, Governor Roy Cooper mandated a statewide shutdown. This has caused significant economic loss as travel and tourism has drastically decreased. Which position best represents your view about the shutdown?
- I support shutting down the state because public health is more important, or
- I oppose shutting down the state because it will have a negative economic impact.
56% of total respondents said they supported the shutdown. Women supported the shutdown more widely than men at 63.4%, while men as a group opposed the shutdown of the state by a slim majority of 52.5%
Not surprisingly, those who are more concerned about the public health impact of the virus than they were about its impact on the economy are more far more likely to support Governor Cooper’s shutdown of the state. While 89.1% of registered Democrats support the shutdown and 63.2% of unaffiliated voters support the shutdown, only 24.3% of registered Republicans support the shutdown.
Protests
When asked about the protests which have occurred in the wake of the killing of George Floyd, a black man, by a white police officer in Minneapolis, a majority (53.3%) support the protests. 58.3% of women surveyed support the protests, while a slight majority of men (52.5%) oppose the protests.
The protests find their greatest support among those aged 18 to 34 at 73.2%. A majority of those respondents between the ages of 45 to 54 and 55 to 64 oppose the protests, at 59.4% and 58.7% respectively.
Republicans overwhelmingly oppose the protests (79.3%), while Democrats overwhelmingly support them at 85.2%. Unaffiliated and third party voters support the protests, although at smaller margins at 61.6% and 51.7%, respectively.
Similarly, self-identified conservatives oppose the protests by 80.1%, while self-identified liberals and moderates support the protests at 93.3% and 67.4%, respectively.
Voters with a high or medium propensity to vote are evenly split in their support for the protests, while a significant majority (62.9%) of those with a lower propensity to vote support the protests.
White voters are evenly split in their support for the protests (50.4% supporting and 49.6% opposing), while 100% of African-Americans surveyed support the protests. A significant majority of Hispanic-Americans, Asian-Americans and others support the protests at 67.6%, 72.6%, and 77.9% respectively.
Those with a Bachelor’s or advanced degree are also evenly split in their support for the protests (with 50.3% supporting and 49.7% opposing them). Those with some college or high school degrees (or no high school degree) oppose the protests by a slim majority of 55.4% and 55.8%, respectively.
Respondents with an annual income of less than $100,000 are also evenly split for their support for the protests, while those making more than $100,000 a year support the protests by a slight margin of 54.6%.
Looting
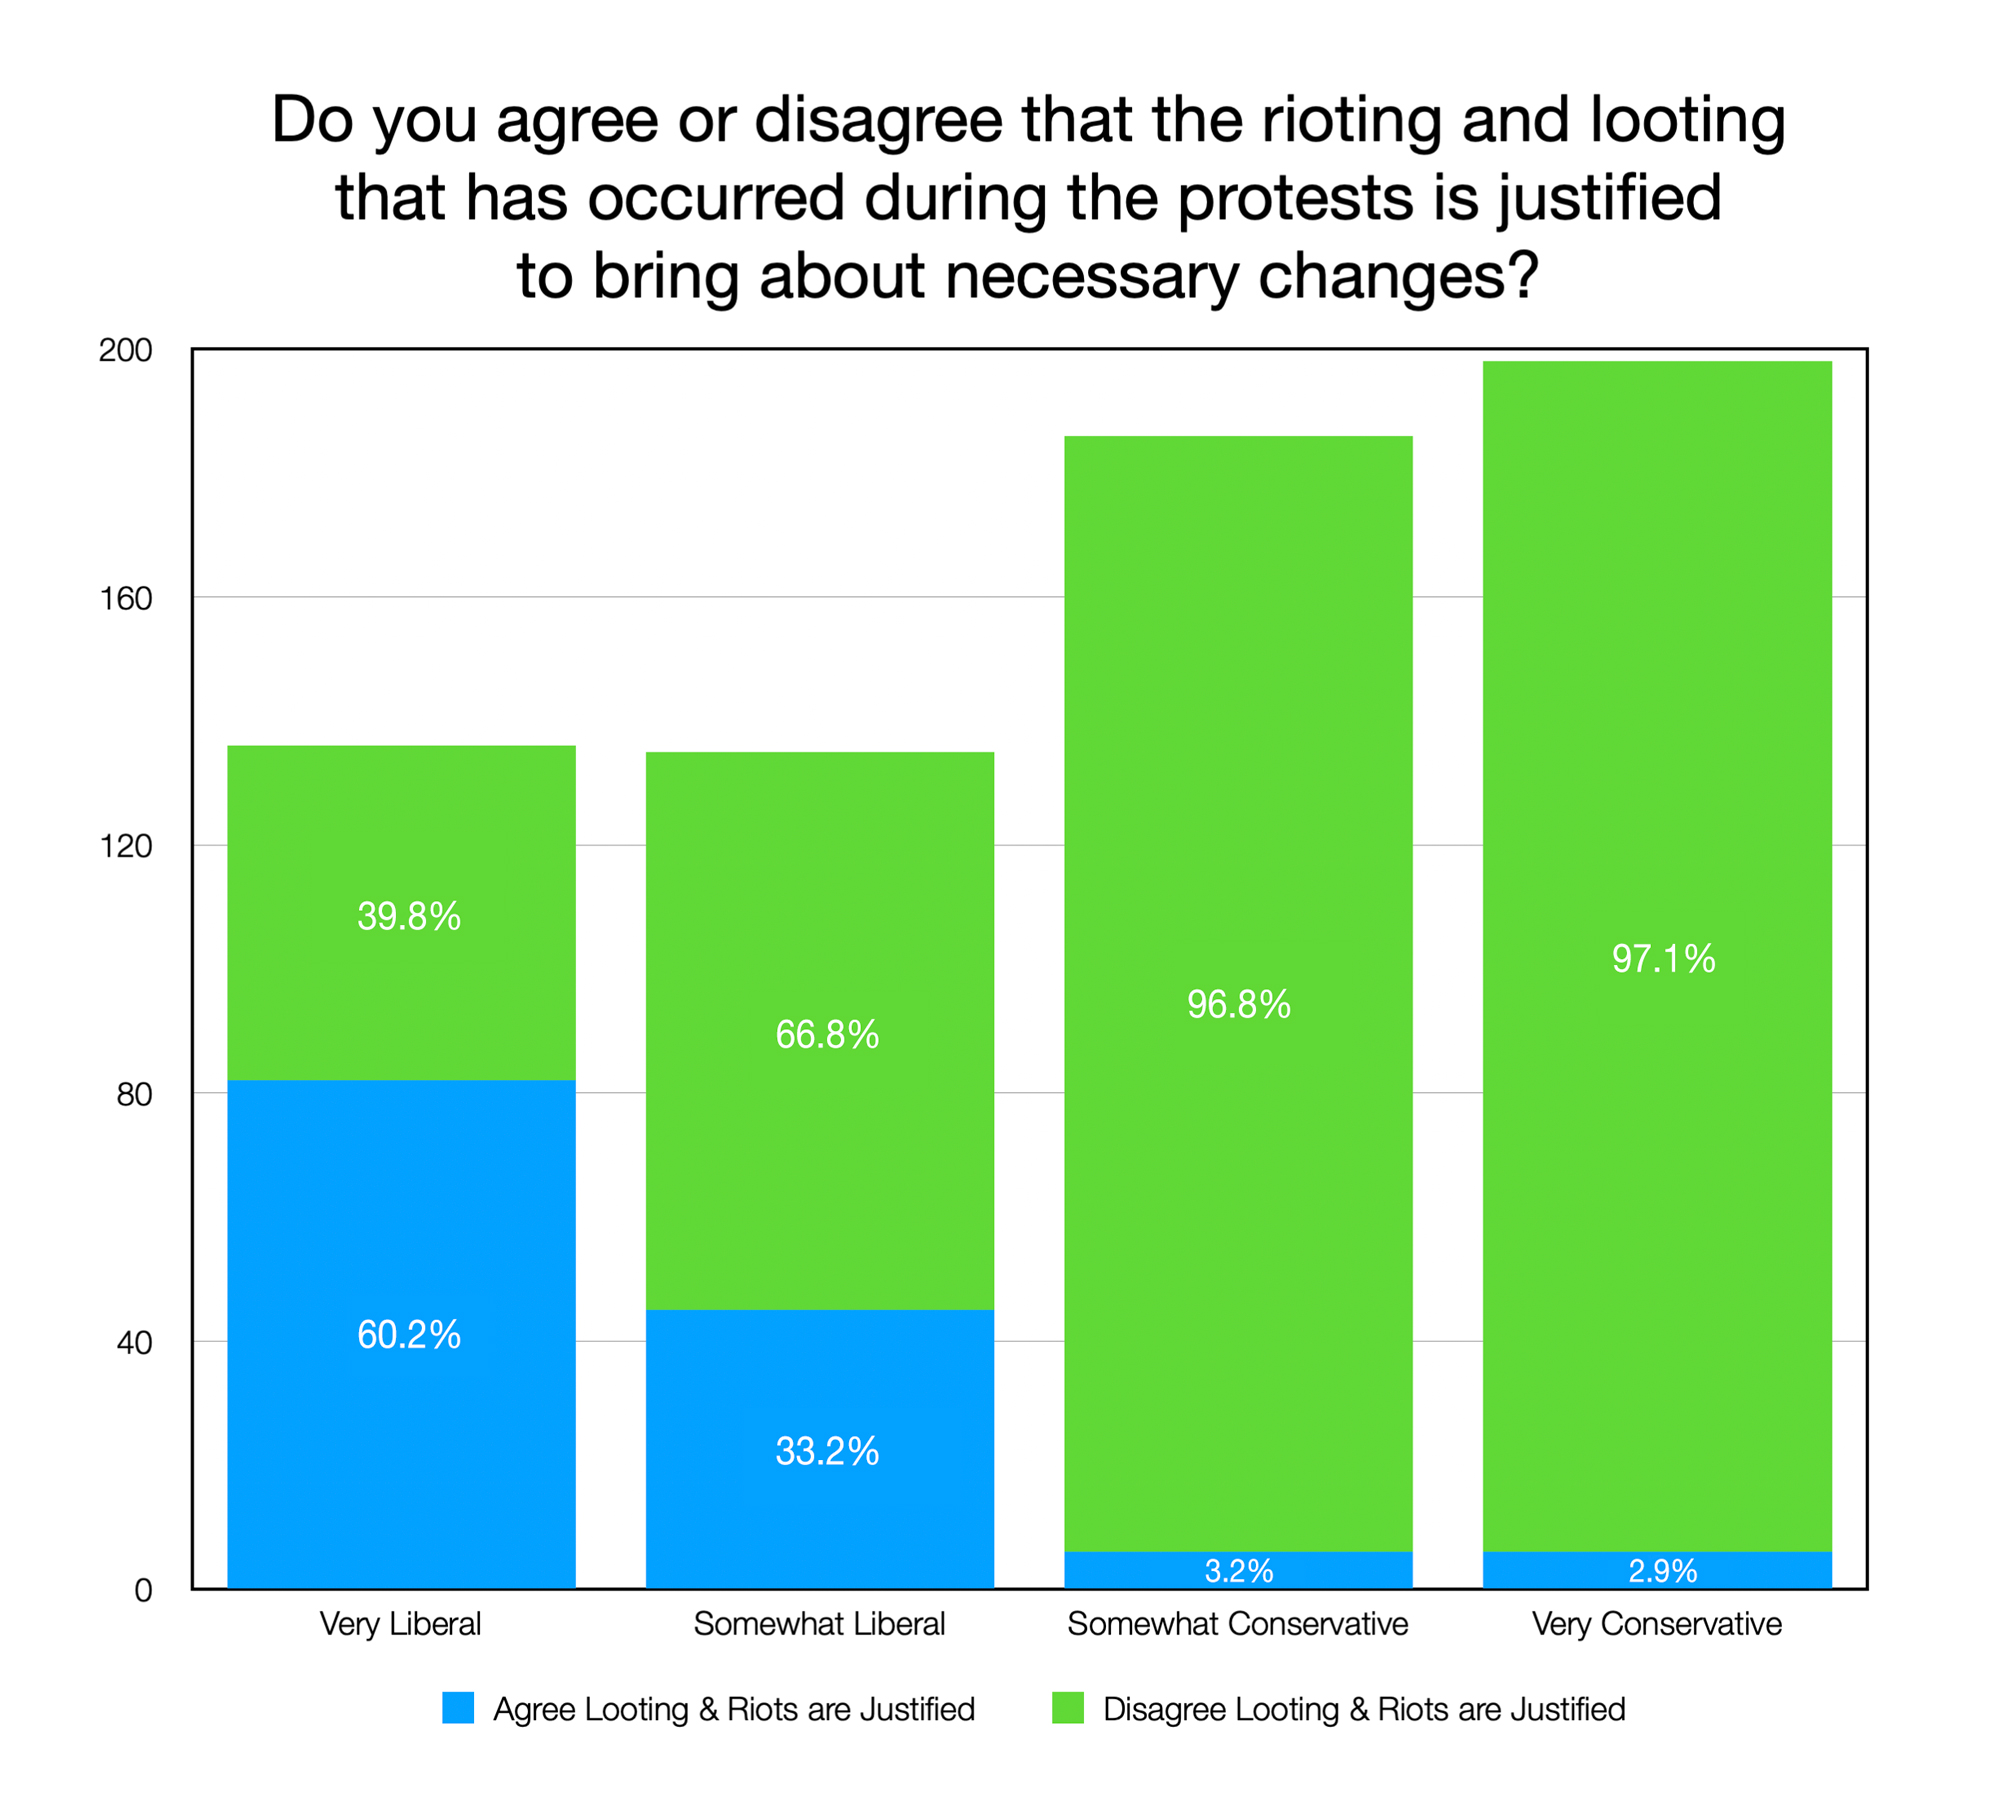
Respondents were asked the question “Do you agree or disagree that the rioting and looting that has occurred during the protests is justified to bring about necessary changes?” A large majority of those surveyed (79.9%) disagree that riots and looting are justified.
Those aged 18 to 34 years old are evenly split on the question, with 48.6% agreeing that riots and looting are justified. An overwhelming majority (an average of 87%) of the other age groups surveyed disagree that the riots and looting are justified.
Republicans are united in their disagreement that the riots and looting are justified, with 95.8% indicating so. Interestingly, more than a third of Democrats surveyed (36%) say they agree that the riots and looting are justified. Unaffiliated and third party voters disagree that the riots and looting are justified at 77.1% and 72.5%, respectively.
Similarly, 97% of self-identified conservatives and 82.4% of self-identified moderates disagree that the riots and looting are justified, while nearly half (46.8%) of self-identified liberals agree that the riots and looting are justified. 60.2% of “very liberal” voters agreed that the riots and looting are justified.
This is the first article in a series of four that will summarize the findings of polls commissioned by the Carolina Leadership Coalition over the summer. These polls were conducted by an award-winning national public opinion and predictive analytics firm which surveyed likely general election voters in four discrete geographic regions of North Carolina. You can download the full model of the mountains region here.